Inside Orion™ HT: The High-Throughput Spatial Proteomics Platform Built for Biomarker-Driven Clinical Research
Why RareCyte built the high-throughput Orion configuration to run single-round, 20-channel spatial proteomics at the cohort sizes biomarker-driven clinical research demands.
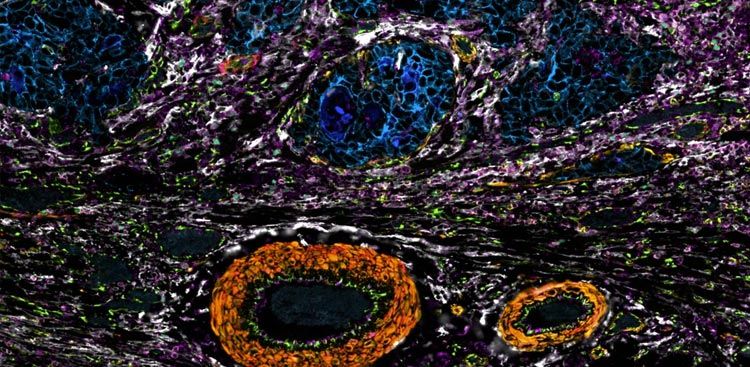
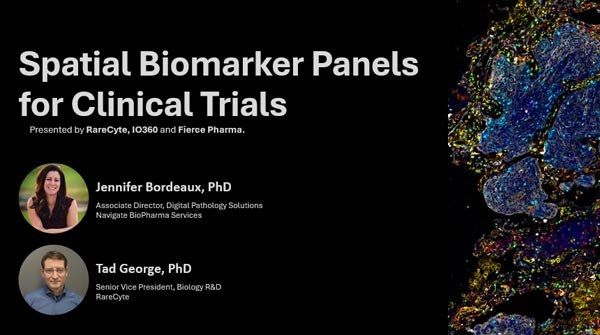
RareCyte’s Dr. Tad George, Senior Vice President of Biology R&D, walks through Orion HT, the high-throughput configuration of the Orion spatial proteomics platform, built to run high-plex biomarker studies at the cohort sizes clinical research demands. His central argument is a tradeoff: precision therapies push researchers to measure more biomarkers to resolve a tissue microenvironment while still analyzing large cohorts for statistical power, and before Orion you generally had to choose one or the other. George shows how the platform resolves that tension by imaging 20 channels in a single round — staining once and scanning in one pass, with staining decoupled from imaging — and how the HT layers on 30-slide, barcode-tracked, 24/7 walkaway automation to carry those single-round panels across clinical-scale studies.
In this video:
- The problem Orion targets: precision therapies demand more biomarkers to resolve a microenvironment while still running the large cohorts that statistical power requires.
- Single-round, defined: 20 channels in one pass on a slide stained once, keeping tissue intact for same-section H&E. Cycling is a separate, optional route to higher plex.
- Where the throughput comes from: staining is decoupled from imaging and run in batches in parallel to scanning, which George puts at up to about 20 samples per day.
- What the HT adds: a 30-slide, barcode-tracked autoloader for unattended 24/7 walkaway runs, with slides added, removed, or re-prioritized while jobs are still running.
- The reagents: directly conjugated, IHC-validated ArgoFluor antibodies across 200+ biomarkers, assembled with a Panel Design Tool at about $30 per biomarker per slide.
- Two services-lab case studies: a 12-patient neoadjuvant dual-checkpoint colorectal study at 13-plex, and a 74-patient retrospective colorectal cohort screened at 17-plex.
Full transcript
Moderator: Welcome, everyone, to today’s webinar — Inside Orion HT, the high-throughput spatial proteomics platform built for biomarker-driven clinical research, presented by RareCyte. I’d like to introduce our speaker today, Dr. Tad George, Senior Vice President of Biology R&D at RareCyte. Tad will walk through the Orion HT spatial proteomics platform in detail — its single-round, high-plex advantage, its walkaway automation, and its high-throughput workflow. As a quick reminder, we’ll have a Q&A session after the presentation; please submit your questions through the Q&A tab. Thank you for joining us today. Tad, over to you.
Dr. Tad George (RareCyte): Thanks, Rob, and thanks for joining the webinar today. We’re pretty excited here at RareCyte — we recently launched the Orion HT, so I’ll talk about that in detail. But to back up a little, the impetus behind the Orion spatial proteomics platform really came from the relatively recent push into precision therapeutics. Precision therapies are designed to alter tissue microenvironments, recruiting the right cells in the right state to improve patient outcomes. That has placed pressure on the clinical research space, because you need to measure more biomarkers than have historically been required for traditional therapeutics in order to resolve those tissue microenvironments, and you still need the sample throughput to analyze large sample cohorts for statistical power.
Prior to Orion, you really had to choose one or the other — plex versus capacity. There are lots of great tools in the proteomics space that let you measure large numbers of biomarkers on the same sample using cyclic immunofluorescence or other technologies, which give you a tremendous amount of information, but the throughput is limited. The traditional tools used in the high-volume space, like IHC or low-plex multiplex IF, do have the capacity to get through large studies, but they don’t carry enough information to resolve microenvironments. So the Orion paradigm shift is really the ability to do 20 channels in a single scan, with the workflow parallelized — we stain in parallel to imaging — which allows you to run up to 20 samples per day. That gives you the combination of high plex with high capacity.
Depending on how it’s used, in the clinical trial space it lets you measure biomarkers of therapeutic response and do predictive and prognostic biomarker work; in core-facility settings it enables not only large studies but also multiple users per week. All of that was driven by Orion’s 20-channels-per-round staining and imaging, which unlocked the throughput while also preserving data quality and the tissue itself. With the release of the Orion HT, whose workflow I’ll cover in detail, the instrument gives you very large capacity. The system also comes with reagent infrastructure at low run cost, because we wanted the ability to run experiments to match the capacity the system enables. It’s a whole-specimen imaging system; your specimens are placed on standard glass slides. Another important component is that it’s very easy to develop custom panels, and it’s all built on a foundation of IHC-validated reagents. I’ll cover all of these points as we go.
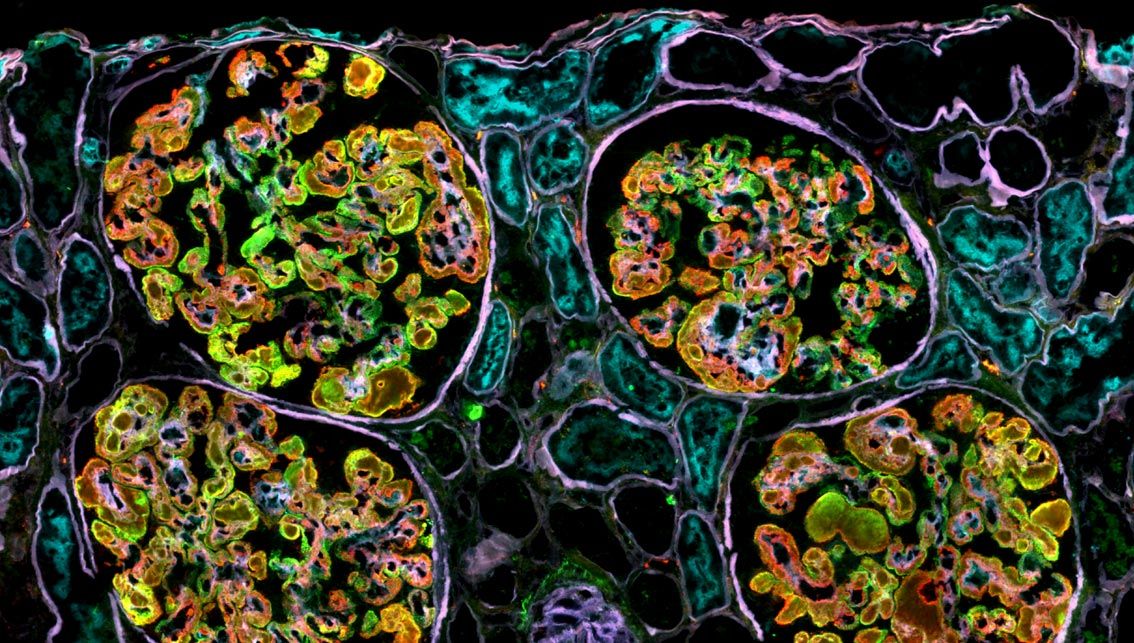
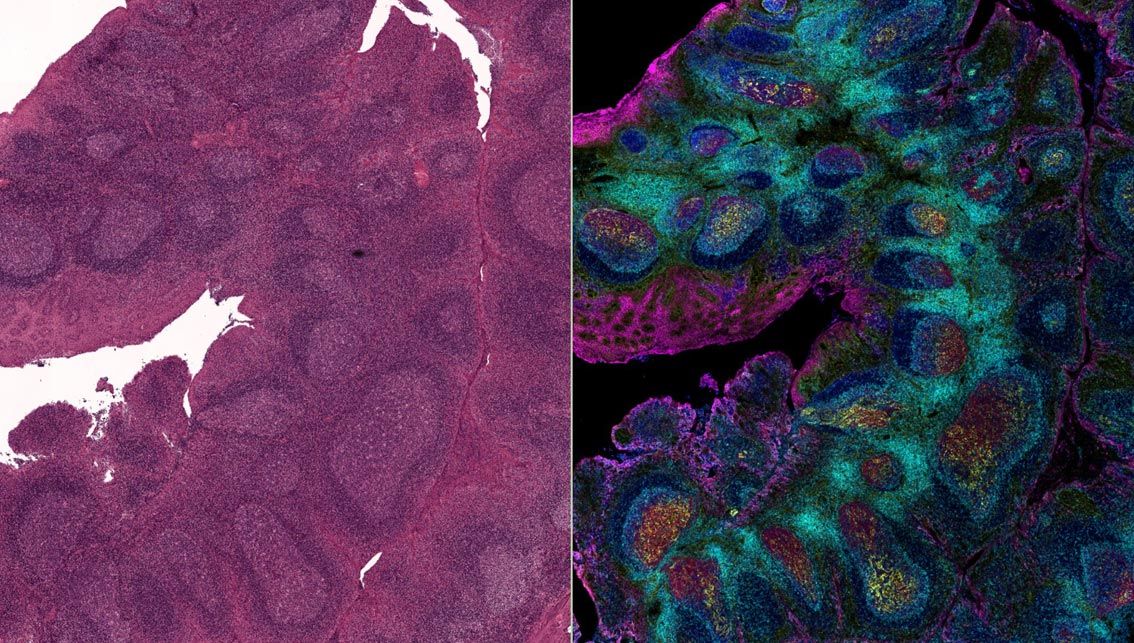
I do encourage you to look at our website — basically any tissue, any indication. The system has been around for about five or six years, and internally, in our services group, we’ve developed over 300 panels spanning all different types of indications. On the website, if you look at the tissue atlas, there are several examples you can explore. If you look at the mouse ileum, you get an interactive, super-high-resolution whole slide. In some cases people will do same-section H&E, so you can see these dark areas are goblet cells that aren’t really stained by the panel; you can easily see that in the H&E, and that’s true H&E. That’s an advantage of having a single-round, tissue-preserved situation — it’s very easy to do this type of work. So I encourage you to check out the website to get an idea of how people are using the system.
I mentioned that building custom panels is really straightforward. The Orion reagent ecosystem is designed for rapid development of custom panels, because we know customization is critical, and that’s driven by the building blocks shown here. One is that we have antibodies directly conjugated to ArgoFluor dyes. The catalog is quite extensive — as of today we’re up to 571 different antibody conjugates spanning over 200 biomarkers. They’re very low in price, so it’s quite affordable to run experiments with the system. Each of these reagents has been validated against IHC on FFPE tissues, and they’re all pre-titrated to work together under the same antigen retrieval conditions, so it’s very easy to combine them in any combination.
We also offer core panels, which are high-plex, indication-specific panels that carry phenotypic and functional markers for human and mouse. They’re fully customizable; people typically use them as building blocks, starting with the core panel and adding, replacing, or removing markers. And if any biomarkers aren’t in our catalog, it’s very simple to make your own with the ArgoFluor dyes, which we sell. These dyes are selected for their brightness, photostability, and spectral spacing, and the conjugation chemistry is simple — it just requires pipettes and spin columns. If you want, you can take advantage of our services as well. So that’s how you build panels.
In terms of testing samples, it follows, for the most part, standard IHC protocols. One major key is that the staining is done separately from the imaging — not on the same instrument. In our services lab we typically stain in batches while we’re scanning things we stained the week before, so you have this high-capacity workflow where everything is done in parallel. I’ll talk quite a bit about the Orion HT, because there’s also scanning automation connected with quantitative analysis to give you a quantitative stream of results. But in terms of preparing your samples, you just place them on normal glass slides. It can be large specimens or multiple specimens per slide, so it’s very flexible. All of our reagents are validated for FFPE, but many people do fresh frozen as well.
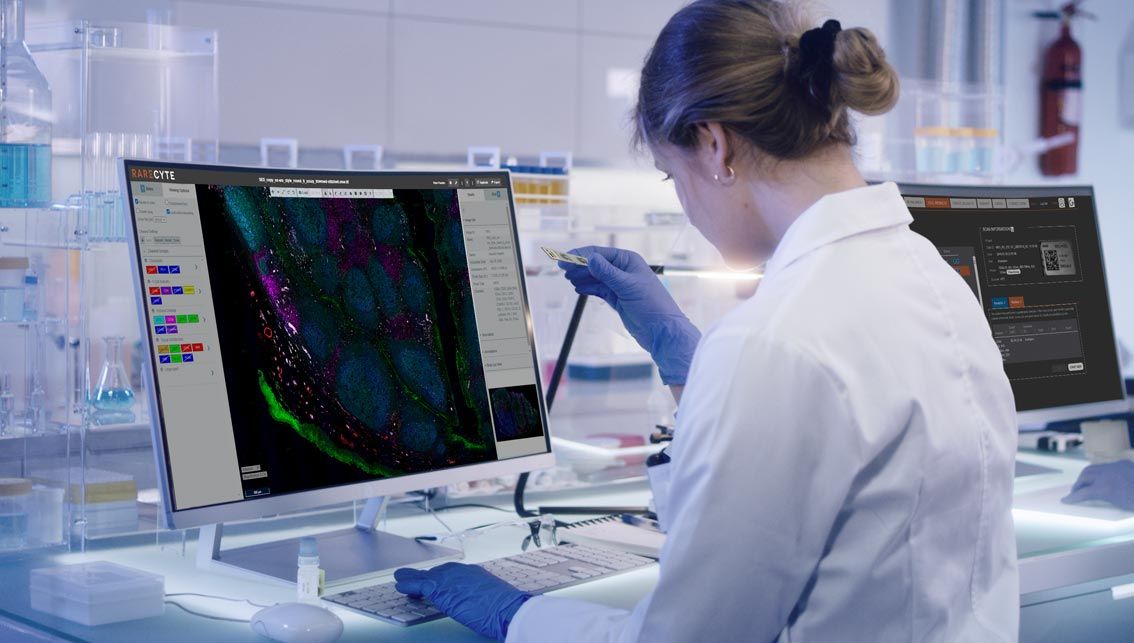
Once you’ve done that, you do the typical IHC protocols with dewax and antigen retrieval. The staining is done all at once in a master mix. It’s compatible with automated stainers, but it’s also easy to stain manually, so depending on your infrastructure it’s not hard to do by hand — we often do that in our services — but it is compatible with automated stainers as well. As I mentioned, those fluors are very photostable, so the stained slides can be imaged right away, or they’re stable for at least a year for workflow convenience, so you can scan them whenever you want. The 20 channels are scanned all in one scan; it’s high-speed, submicron resolution. The Orion HT instrument has 30-slide automation for 24/7 unattended operation. There’s also quantitative analysis data output that comes with the system. Outputs include OME-TIFF files, which let you analyze data with your own pipelines if you want, but the system also does segmentation and feature calculation and produces a data table, plus QC reports for tracking key performance indicators when you’re running services. As I showed you earlier, you can also do same-section H&E or additional immunofluorescence rounds — you can cycle with the system. So that’s the workflow.
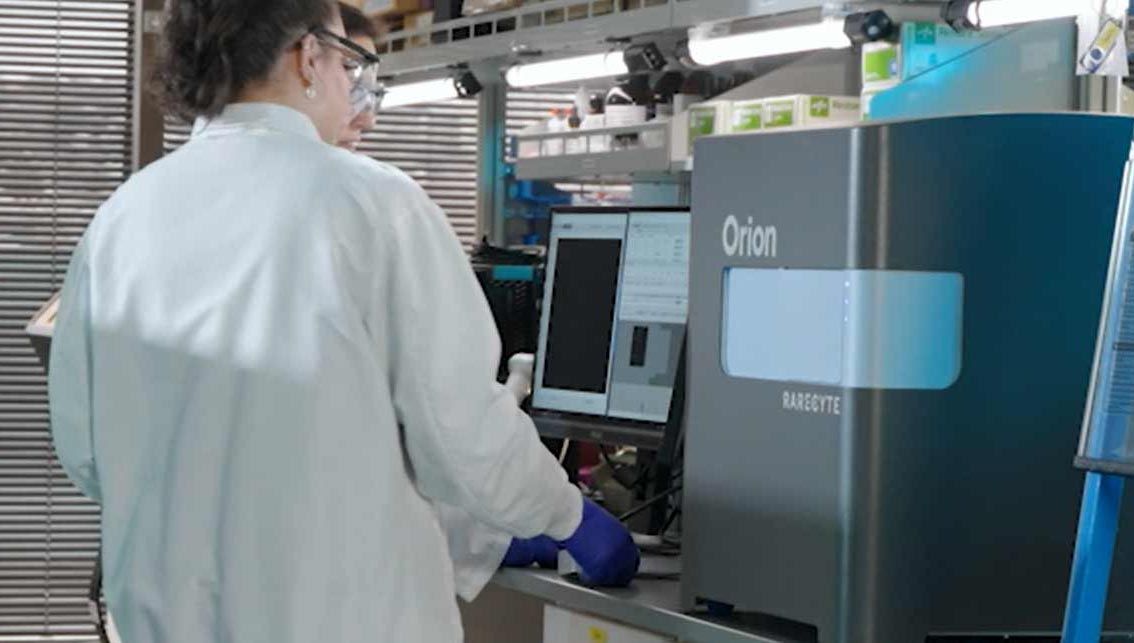
If we talk specifically about the Orion, one thing is that we have multiple Orion platforms, and the topic of today is the Orion HT instrument. This instrument has essentially a 30-slide capacity for multi-scan planning and execution. The way the software works, the 30-slide capacity was intended to get you through a long weekend without having to come in and add or remove slides, but throughout the week it allows continuous access to add or remove slides and prioritize scan order. It has barcode-driven workflows to maintain sample chain of custody, and a database that tracks system usage for billing and the like. So that’s the big picture of what the Orion HT instrument is like.
In terms of planning what’s done with each slide on the system, that’s done through a system called jobs. A job is basically a set of actions performed on a set of slides or files, defined in the software by a pipeline. They can include steps such as pre-scanning, which is a low-resolution whole-slide imaging step to facilitate remote ROI drawing; acquisition of the high-resolution, all-channel scan of the slide; processing to extract spectral overlap; and then an analysis pipeline to generate a quantitative data-table output. There’s an interface where you can define those jobs, view and edit them, view the status of ongoing jobs and complete them, and clone completed jobs. The system gives you a historical view of all the jobs that have been done on it.
In terms of interacting with the instrument, slides are placed in two-slide carriers. Those carriers can either be stacked onto 30-slide-capacity hoppers and loaded onto the system through the hopper door, or loaded directly onto the stage through the stage door if you’re going to do manual scanning — so you can do manual or automated loading. Once the doors are closed, the internal barcode readers take an inventory of what’s in the hopper and on the stage. For slides already associated with jobs, they’re added to the scanning queue; otherwise, they’re held in the system until they’re assigned a job. Slides that are new to the system are added as new records and held until assigned a job, and slides without barcodes are loaded through the stage door and can be scanned manually. The system has three barcode readers — an external reader, the hopper-door reader, and one near the stage door for taking inventory of those two areas. So that’s how the barcode system works.
For slides that are on the system, this is the slide scheduler interface. The system provides the physical location of the slides, the scan order, what jobs they’re assigned to, and the scan status, as well as the projected scan time and file size the scans will occupy. As I mentioned, it also enables continuous access for adding and removing slides while the jobs are running, and you can re-prioritize the scan order. You have scan-automation controls, including scan pause and abort, and automated door controls for sample access.
The acquisition window lets you scan manually and also define ROIs and focus points without doing a pre-scan, which I’ll talk about in a moment. It’s an immersive whole-slide, multi-resolution image canvas with interactive stage, channel, and resolution controls, and it has the same scan-automation and door controls that were on the slide scheduler interface. If you take advantage of the pre-scan, the interface is very similar, but it also lets you remotely draw ROIs for scanning. The way we think of an ROI is basically a geometric scan plan, which consists of a bounding polygon corresponding to the region of interest of the tissue to be scanned. Notice the bounding polygon can also be plural — we can have non-continuous polygons that still represent the same sample, such as a core needle biopsy that was broken up into two pieces; even if they’re non-continuous, you can draw those together as one scan. There’s also a stamp for defining a background region, which is a glass-only scan area used to generate a dynamic background model, and focus points, which are used to define the Z contour and have automated default locations that the user can add, delete, or move. You can have multiple polygons for one ROI, multiple ROIs per slide, and the ROIs can be drawn remotely. So that’s the Orion HT interactivity.
In terms of quantifying the data, as I mentioned the Orion software also has segmentation, feature calculation, and a classification window. The cell segmentation and feature calculation are performed in parallel to imaging, meaning once you scan your first slide, that file is processed and the data table is generated on-premises at the instrument while it’s scanning the next slide. So it dramatically increases throughput for high-volume workflows. It also allows remote data access for ROI annotation and cell classification to generate spatial biomarkers. Typically you’ll classify cell types and states, which lets you measure densities and frequencies and summarize across cohorts. That’s typically how the analysis works.
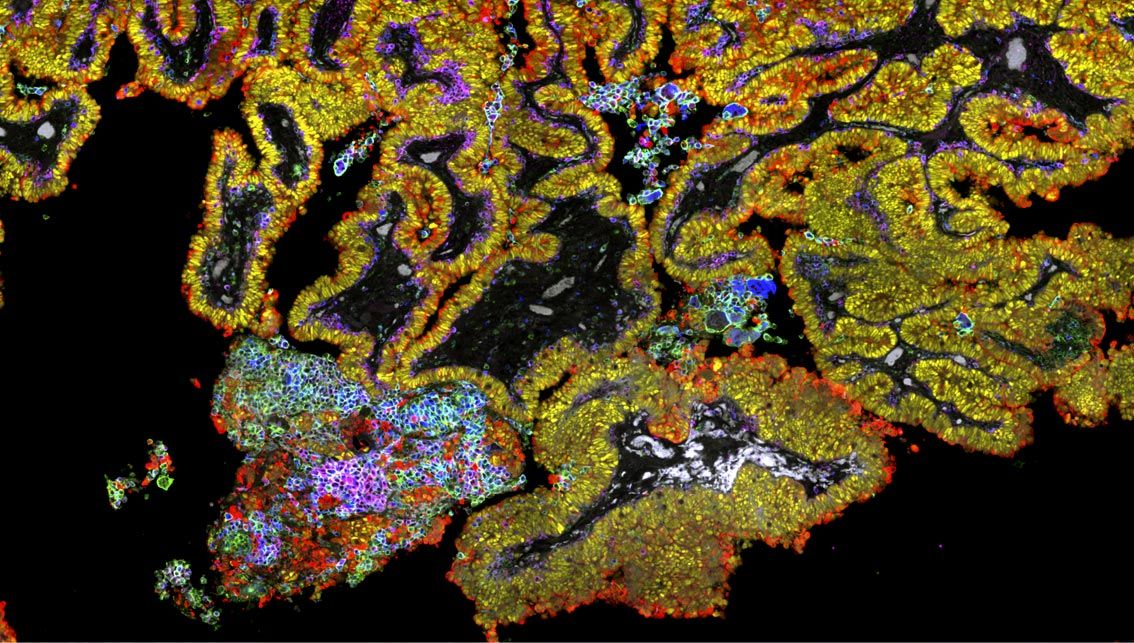
A couple of case studies. This first one is a prospective study done through our services lab. Agenus had empirically found that giving dual checkpoint inhibitor therapy dramatically shrank colorectal cancer tumors prior to surgical resection, but they didn’t really know what the mechanism of action was. They enrolled 12 patients into a study where they had pre-treatment core biopsies and post-treatment surgical resections, processed with a 13-plex Orion IO-biased panel. This is one of the surgical resections; you can see normal colonic mucosa — here’s a large region, probably five or six square centimeters, of normal colonic mucosa, with pan-CK in yellow and some T cells in white around the crypts, which is normal. What’s not normal is this swarm of T cells. If we pan to the right, that’s where the active tumor is, and dividing here — the red is Ki-67, and CD3 is invading the tumor, certainly associated with the tumor being killed off. Of course you can see images, but it’s more important to quantify them. If we look at the pre-treatment biopsy in blue and the post-treatment surgical resection in gold, you can see that in this particular case the treatment caused recruitment of all the major immune cell types in and around the tumor, which is associated with the resorption of the tumor prior to surgery.
For a larger study, this is a retrospective study by one of our customers at Harvard. It’s a 74-patient colorectal cancer study where they already had patient outcome data, and they used a 17-plex across that clinical cohort to bioinformatically assess several hundred potential spatial biomarkers to see which one gave the best hazard ratio. They found quite a few candidates that outperformed the current gold standard prognostic test for colorectal cancer progression. This ties high-resolution scanning together with sufficient plex across a large number of samples to draw statistically robust conclusions.
So, basically, we view Orion as an ecosystem for spatial biomarkers at scale. There’s the Orion instrument itself, with that paradigm-shifting 20-channel single-round workflow for high-volume programs, but also enabling multi-user environments. We’ve supported instruments in biopharma and CROs, but also academic core facilities, and in all cases there’s really that need for multiple programs, multiple users, and multiple panels, and in some cases high volume, which the system accommodates quite nicely. With the Orion HT, the high-capacity automation really allows for that larger capacity. And don’t forget the extensive reagent infrastructure for developing reliable panels independently — we have an extensive menu of antibodies and kits. It’s a platform where, even though I gave you some examples of clinical research, that single platform can span the discovery, translational, and clinical-research continuum, all with the same reagents and instrumentation. So with that, thanks for your attention, and please ask any questions you have.
Moderator: Great, thank you, Tad. It looks like we did have a few questions come through. The first one: is it difficult to create custom biomarkers? Can you go into that a little more?
Dr. Tad George (RareCyte): That’s an excellent question. As I mentioned, when you’re developing panels — a long time ago, before we had anything in the catalog, every reagent was custom. But now we have a very extensive catalog; it’s over 550 reagents in the catalog spanning over 200 biomarkers. Still, it’s pretty common that with custom panels there are usually a few biomarkers we don’t sell in our catalog. So in that case, creating custom biomarkers — the answer is no, it’s not difficult. The main thing is to validate the clone in IHC first. Before you’re using the Orion system, establish a control block that expresses the biomarker reliably, find the clone that accurately represents the biomarker you’re interested in, and verify that the clone and control tissue work by IHC. Once you have an IHC-validated clone, creating the custom biomarker is quite simple. You do need to label that antibody with an ArgoFluor — we sell the kits, and it’s very simple, random amine conjugation chemistry that just requires knowing how to use a pipette and spin columns and following a protocol. Then, on an adjacent section, you demonstrate that the stain pattern in IF on the Orion is similar to the IHC pattern. Internally, our success rate is well over 98%. Every once in a while there’s an antibody that doesn’t like to be labeled with amine conjugation chemistry, but it’s super rare, and in those cases we just find a different clone. So that’s the process. Good question.
Moderator: Another question: how long would it take to run 30 slides?
Dr. Tad George (RareCyte): Good question, and that probably comes from the fact that we have this 30-slide autoloader. It really varies on two things: how large the scan area is for the specimen, and how many channels you’re going to scan. Let’s assume you’re going to scan all 20 channels. It takes a little over an hour — about 75 minutes per square centimeter — to scan a specimen at all 20 channels. So if you have one square centimeter, it’s going to take about 75 minutes per slide, and 30 slides will take you a little over 40 hours. Now, if you have a large specimen — say, like the colorectal cancer Harvard study, where I think the average is six square centimeters — each one is going to take eight hours. In that case, in terms of loading the HT, the system will tell you: if you load 10 slides that are going to take eight hours each, it will let you know that’s 88 hours sitting on the machine, and typically people would just not load that many. They’d take half of those out, put them in the freezer, and load them when they’re ready. So it very much depends on how big the specimen is, and also the number of channels — if you’re doing 10 channels instead of 20, it’s going to go twice as fast. Good question.
Moderator: To go along with that, from the same person: what’s the average run cost? You talked earlier about the reasonable price on the biomarkers — what’s the run cost?
Dr. Tad George (RareCyte): For Orion, the run cost is dominated by the cost of the antibody conjugates that are used. Our list price for our reagents averages around $30 per biomarker per slide. There are some other costs associated with buffers, dewaxing, antigen retrieval, and so on, and you have to buy the nuclear dye separately, so that adds maybe 2% to the cost of running, but usually you recover that by diluting some of the antibodies a little. So if we assume it’s driven entirely by the antibody-conjugate cost of about $30 per biomarker per slide, then if you’re doing a 15-plex, you’re looking at about $450 to run. So it’s quite reasonable. Good question.
Moderator: Thank you. And one more question: does RareCyte offer panel development support?
Dr. Tad George (RareCyte): Yes, there are a couple of ways. For customers who own an Orion system — I didn’t mention this, but it also comes with access to a panel design tool. That panel design tool is really nice because it’s connected to our catalog. It has the biomarkers arranged in a straight list, but also grouped in panels and grouped in themes, so it’s very easy for people to rapidly assemble the biomarkers they want into a panel. Then there’s an algorithm that, depending on which markers you’ve selected, tells you which products to buy for that panel to work really well together. Typically you order that panel, and we recommend a quick titration on your tissue type of interest to make sure you’ve got optimal performance on your tissue type. That comes with the system, and we train you how to use it. When it comes to custom biomarkers, that’s also part of the training — we teach you how to do that. And a lot of our pharma clients will pay us to do it, because we offer services as well. So there are many ways to get support for rapid panel development. Good question.
Moderator: One more here. You talked about the ROIs on the slides — can you fit multiple samples on a slide, or are you limited to a single sample per slide?
Dr. Tad George (RareCyte): Good question. No, you can definitely put multiple samples on a slide; it’s pretty common, and a lot of our customers do that. People do TMAs all the time on the system. We’ve seen people put as much as 13 or 14 different small specimens on a slide — different organs from a mouse, for example. And the staining cost is the same no matter how many samples are on there, so it’s actually quite common for people to do that. It depends on your situation, of course — if you have control over the blocks, it’s easier to do that. A lot of our pharma partners don’t have that luxury, because they’re coming from the hospital and so on. But the short answer is certainly yes, and it’s pretty commonly done.
Moderator: Great. Do we have any other questions from anybody attending today before we wrap up? I just want to make sure we cover everything. Okay, Tad, thank you very much — it looks like that’s all the questions we had today. If anybody has any questions, you can contact us at info@rarecyte.com or please visit our website, and we’ll follow up to let you know when the recording is available in case you’d like to watch again or share it with your colleagues. Thank you, everybody. Have a great day.
Transcript reproduced from the recorded webinar and lightly edited from an automated caption source for speaker labels, obvious transcription artifacts, and the accuracy of proper names; the speaker’s words are otherwise as delivered. Product names were normalized to their correct forms (for example, ArgoFluor, OME-TIFF), and one company name that the automated captions rendered as “Genentech” was corrected to “Agenus” against RareCyte’s own record of the same case study. Statements of affiliation, quantities, and study details are reproduced as spoken by the presenter and may differ from formally published values.