Breaking Barriers in Spatial Proteomics with Single-Round Imaging
RareCyte’s Tad George on how the Orion™ platform stains a tissue section once and images 20 channels in a single pass, and why that single round is what keeps the tissue intact behind trustworthy spatial data.
Single-round imaging means the tissue is stained once and imaged once, across 20 fluorescence channels, rather than built up through repeated stain-and-strip cycles. In this RareCyte webinar, Tad George (SVP, Biology R&D) walks through how the Orion platform uses that single round to reach what he calls spatial biology at light speed: because the section is never stripped and re-stained, its antigens and architecture stay intact, giving trustworthy, fully quantitative data across the large cohorts that translational and clinical studies require. For panels beyond 20 markers, George notes the Orion can also be cycled over multiple rounds, but the single-round, up-to-20-channel workflow is the translational workhorse.
In this video:
- Single-round, defined: the panel is stained once and imaged in one pass across the Orion’s 20 channels, not built up through repeated stain-and-strip cycles.
- Why single round matters: because the section is never stripped and re-stained, its tissue and antigens stay intact, the foundation for trustworthy, fully quantitative data.
- Throughput at scale: one round lets an academic core serve roughly 10x users per week, and carries whole cohorts to Kaplan-Meier statistics for prognostic and predictive work.
- The reagents: over 100 IHC-validated ArgoFluor direct-conjugate antibodies, 16 human and six mouse panels, plus conjugation kits, custom services, and a panel-design tool.
- How 20 channels fit in one round: nine narrow-band lasers, factory-tuned filters, 17 ArgoFluor dyes, automated cross-talk extraction, and a dedicated autofluorescence channel.
- Beyond 20 markers, kept distinct from single round: for discovery plex like a 51-plex cyclic run, the Orion cycles over multiple rounds to inform a smaller single-round panel.
Full transcript
Moderator: Welcome everybody, and thank you for joining RareCyte for today’s webinar, Breaking Barriers in Spatial Proteomics with Single-Round Imaging. I’d like to introduce Tad George. Tad is a senior VP of biology at RareCyte and has been with RareCyte for about eight years. He has a long history of introducing breakthrough technology into research, clinical, and translational environments as part of numerous startup instrumentation companies in the past. He has worked closely with the engineering team at RareCyte to develop and introduce the Orion technology for translational spatial biology, which is the subject of today’s webinar.
Tad George (RareCyte): Hello everyone, and thank you for joining our webinar about breaking barriers in spatial proteomics using the Orion system with single-round imaging. Before we get going, I want to introduce RareCyte. We’re a precision biology company that creates breakthrough technologies focused on areas related to liquid and tissue biopsies. We design cell instruments, reagents, consumables, and services, both for ultra-rare cell analysis and retrieval and for highly multiplexed tissue analysis. That highly multiplexed tissue analysis, with the Orion system, is the focus of what we’ll talk about during this webinar.
As most of you who study tissue and spatial biology know, tissue contains many different cell types. They have different functions, they’re in different functional states, and their spatial arrangement can dramatically impact a patient’s health status. So if you’re going to study spatial biology, you’re going to use scanning and imaging technologies to resolve those spatial relationships. Traditionally in this space, if you’re working with fluorescence, resolving this complexity has been challenged by fluorescence overlap and by autofluorescence, which leads to techniques that really challenge throughput. Orion technology is focused on breaking that throughput barrier by doing ultrafast, highly multiplexed tissue analysis in a single round.
So Orion is what we like to call spatial biology at light speed. The main thing about Orion is that in a single round of staining and imaging we’re able to collect 20 channels of data. Because it’s a single round, the technology is ultrafast. In an academic core facility setting that can mean roughly 10 times the users per week if you’re doing small studies. But if you’re in the translational or clinical space, it’s really important to get through large numbers of samples to get statistically meaningful prognostic, predictive, or mechanistic data. We like to say Kaplan-Meier curves for clinical studies. Doing this in a single round is also very efficient in terms of running cost. And by doing everything in a single round, the data quality is high because the tissue is preserved. Another point that’s really important is the flexibility of the panel design, which we’ll cover extensively.
Up front: any tissue, any indication, 20 channels in a single round. We’ve done over probably 250 panels, and there really isn’t any limitation to the type of tissue or sample that can be addressed. It doesn’t even have to be tissue; it can be spheroids, organoids, anything, though most people are usually working with FFPE tissue. I do encourage you to look at the interactive page on our website, which gives some nice examples spanning various tissue types and applications.
For example, if we look at mouse ileum here, this is a 16-plex mouse ileum. You can zoom in to see the high data quality, and it’s whole-slide. We can also do same-section H&E, so you can see the goblet cells with that morphology aligned to the molecular information from the IF. That’s another nice feature of doing things in a single round: you can get pathologists involved quite easily with the same-section H&E. It’s not only whole-slide, it’s whole-study. One of our customers did a 74-patient colorectal cancer cohort, and all of those examples are here. Just as with the ileum, you can zoom in and pan and see very high quality across the whole slide. On average these tissues were about five square centimeters, and of course it’s not just one sample, it’s hundreds of samples.
From a big-picture standpoint, that’s the breakthrough for Orion in the field. The data is fully quantitative: you can segment the images into cells, which lets you get molecular biomarkers and mean intensities for all the different biomarkers, along with the centroid positions, which let you classify cells into different populations and move forward into spatial biomarkers.
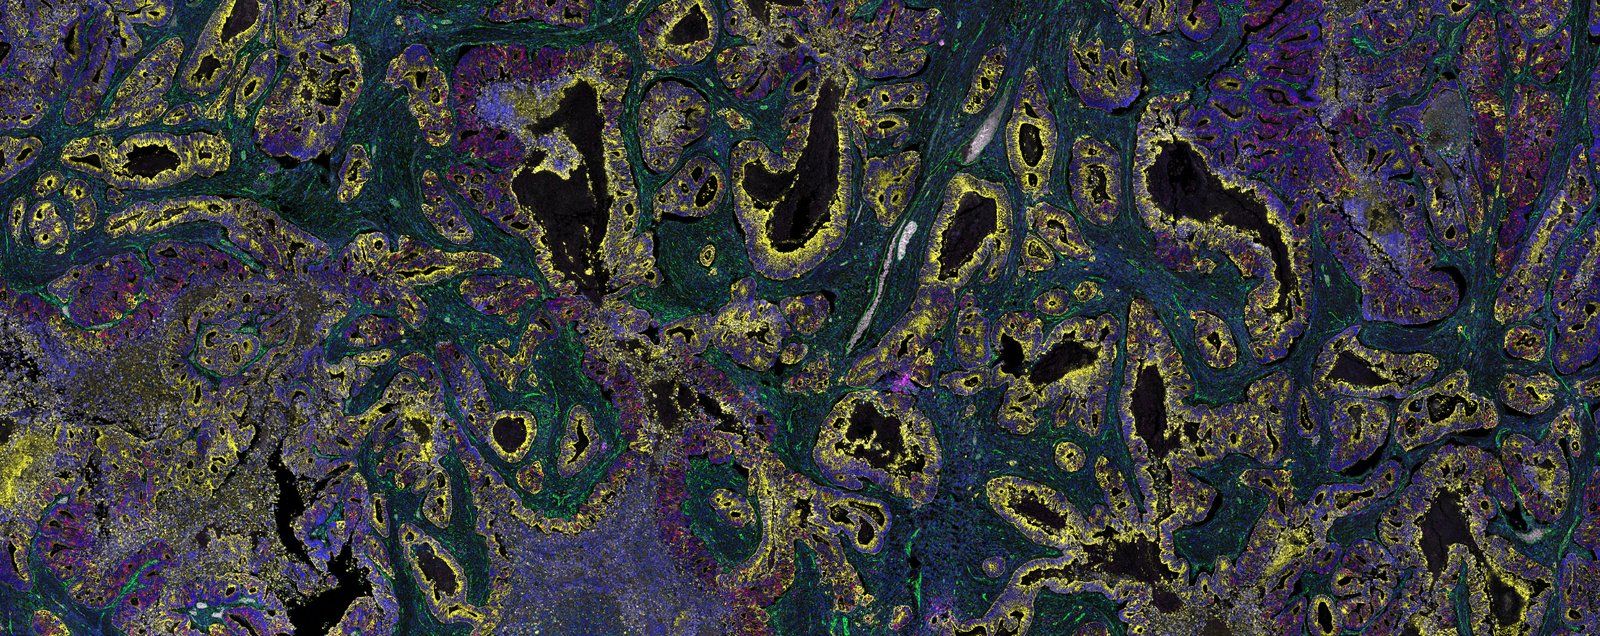
Let me give you a couple of case studies. The first was a drug company looking to Orion to uncover the mechanism of action for their dual immunotherapy trial. They had found empirically that treating patients with two of their drugs reduced colorectal tumor size prior to surgical resection, but they didn’t really know the mechanism. They enrolled 12 patients, got a pre-treatment biopsy as well as a post-treatment surgical sample, processed them with a 13-plex IO-based Orion panel, and measured the density of different cell types within the tumor lesion. In one patient’s surgical resection you see normal colonic mucosa, with the pan-cytokeratin in yellow and T cells in white. What’s not normal is a swarm of T cells to the right, where the aggressive tumor is: lots of highly dividing tumor polyps being massively invaded by T cells that look like they’re doing a nice job of killing the tumor off. Because this is quantitative, we can compare the pre-treatment biopsy against the post-treatment resection and show that the treatment recruited all the major immune cell types into the tumor lesion, associated with regression of the tumor prior to resection.
Another case study is our customer at Harvard, who did the 74-patient colorectal cancer cohort. Because they had clinical outcome data, they could derive prognostic spatial biomarkers. This paper is published in Nature. Essentially, 74 patients’ blocks were processed with a 17-plex Orion panel, and we simulated the Immunoscore, which is a very nice prognostic test for colorectal cancer. They actually derived several hundred potential spatial biomarkers that theoretically outperform the Immunoscore. It’s a nice example of using the system’s throughput to derive potential prognostic tests, in this case in colorectal cancer.
From a big-picture standpoint, Orion unleashes translational spatial biology by bringing together the things that are necessary. First, high quality is the foundation for trustworthy quantitative data; that’s true of any platform. Orion is ultra-sensitive with high dynamic range, good resolution, and image quality, but the single-round sample integrity really helps give a nice foundation for your quantitative results. Complete spatial context matters for deriving spatial biomarkers; if we were just looking at cores drilled out of a tissue microarray, we wouldn’t have gotten those spatial biomarkers, so whole-slide capability was important. You need sufficient plex for biomarker discovery and mechanism-of-action work, and fundamentally the throughput to image large cohorts for statistical power.
The building blocks we provide are centered on the Orion reagent portfolio. We sell ArgoFluor-conjugated antibodies; all of them are IHC-validated and known to work on the Orion system, and there are well over 100 biomarkers available. We also sell off-the-shelf panels: 16 for human and six for mouse. Because there are often biomarkers not in our catalog, we enable customers to make their own reagents with conjugation kits and services, and there’s a panel design tool to help configure custom panels for any application. All of our reagents are sold as direct conjugates in individual vials, even within our panels. For example, if you start with a type 1 diabetes panel, it will show the 16 markers that come in that kit, but you don’t have to take all of them. You can say you don’t want CD20, remove it, put in DC-LAMP, and order that. So it’s very flexible and easy to mix and match to build panels.
The panel development workflow is simple. You use the panel design tool to select your biomarkers; if no custom antibodies are required, the tool assigns the channels for you. Then you order the reagents and verify panel performance at your site with a simple titration on your intended tissue. This matters because in production we validate all of these reagents against control tissues we know work; we don’t validate against every tissue type, so sometimes the abundance or titration needs to be adjusted a little before starting your study. It’s a very simple experiment to verify performance on your tissue of interest. Where you have custom biomarkers, it’s still simple: you validate that reagent versus IHC. The main job there is to validate that the clone you ordered from the vendor, in the control tissue block you’re using, actually gives the result you want by IHC. Once that’s established, you conjugate your clone to an ArgoFluor. One nice thing about the ArgoFluor conjugations is that they use small-molecule organic dyes, very similar to what’s done in flow cytometry, and we really haven’t had a case where we couldn’t reproduce in IF the results we got in IHC, so there’s a very high rate of success. Then you validate that conjugate in a single-plex titration versus IHC. This takes a lab about a two-week process to validate up to four custom conjugates in parallel, so it’s easy to customize your panels.
Once you have your panel running and want to do your study, it’s straightforward. We often stain up to 24 slides per day off the instrument; there’s no staining done on the scanner, so staining is done separately and in parallel to scanning. There’s not much limitation on what you can put on the slide, so you can use large and/or multiple specimens per slide. Because the fluors are very photostable, once you’ve done the staining you can go straight to scanning or bank the slides, which is convenient for a multi-user site: multiple labs can prepare their samples, and scanning can be scheduled anytime the scanner is available. We scan 20 channels per round. It’s a very simple, straightforward workflow, and the output is fully quantitative.
In terms of the technology and validation, I haven’t yet told you how we do what we do. Orion was really an adventure in finding the best set of dyes and instrument attributes that let us image at high plex with direct conjugates, with the sensitivity to see even low-abundance biomarkers, which is critical. Normally, with fluorescent scanners, sensitivity is a major barrier, so people use wide excitation and emission bands to collect as much light as possible. When you’re trying to do 20 channels at once, you want narrow-band excitation and narrow emission bands, so we went to lasers. The system has nine high-powered lasers to give lots of sensitivity and very specific excitation. What’s nice about the narrow-band filters is that in the factory we can tune them with one-nanometer resolution between 425 and 900 nanometers. That let us screen over 300 small-molecule organic fluors for brightness, photostability, and spectral spacing. We found 17 that worked well together in that space, and went to a laser manufacturer to custom-build the laser to match the palette of ArgoFluors. As I mentioned, these dyes are very small molecules attached to antibodies with simple amine conjugation chemistry; all it requires is knowing how to use a pipette and spin columns. They’re a very light touch on the reagents, so we can typically reproduce our IHC results, and they’re stable for many years after conjugation, which enables single-lot, multi-year studies.
Of course, we have spectral overlap, so spectral extraction is done. A major advance is an algorithm that automatically detects the overlap and removes it from the cross-talk channels. For example, CD3 and CD8 can be spatially colocalized and spectrally overlapping. In this panel CD3 is on ArgoFluor 572 and CD8 is on ArgoFluor 602, which are 30 nanometers apart, so there’s a lot of overlap if we don’t extract. The system’s automated algorithm extracts the cross-talk and gives essentially flow-like plots, where you can see CD3 versus CD8. Before extraction there are a few cells cross-listing from CD3 into CD8; after extraction that’s completely removed. That was another major advance that enabled single-round imaging.
Validation is easy. Here’s an example from SOX10: we established the pattern in IHC with clone SP267, labeled it with an ArgoFluor, stained an IF on the Orion, and in serial section the pattern matched. That’s how we validate our reagents. You can also look at specificity. With IL4I1 by IHC we saw a nice punctate stain typically expected to be in macrophages, but in single-plex IHC we don’t actually know for sure that those are macrophages, so we labeled IL4I1 with the ArgoFluor and ran a mini-panel with CD68 and CD163 to verify that the punctate signal was residing within macrophages. The system is accurate and precise: biomarker detection usually matches or outperforms IHC for challenging biomarkers. In one case a pathologist scored IHC for PD1 in colon, which is really dim staining; we had no problem seeing it with the directly conjugated reagent, found more PD1-positive cells, and verified they were T cells by co-staining with CD3. One of our CROs validated a 16-plex Orion panel that we developed and transferred to them against a tyramide-based system and got basically similar sensitivity for MFIs and percent positives. Tyramide is a very powerful technology that sometimes gives 100-fold amplification; it’s necessary for regular scanners, but not for the Orion. The system is very repeatable and reproducible, so it’s well suited to running large studies.
Another key point is that because it’s so easy for us to develop panels, one of the key features of adopting the Orion system is that part of our onboarding program is to design and promote success with a customer panel shortly after training. Once an instrument is ordered, our customer success team works with your site to prepare it and make sure the instrument’s network and the laboratory are set up to support installation and training. We provide training with a standardized 7-plex training panel, and we typically also transfer a customer-specified panel within two weeks of training completion. So we try to shorten the time from Orion order to first experiment by providing that onboarding success.
And with that, that’s an overall summary of Orion. As I mentioned, we like to call it spatial biology at light speed, by taking that single-round approach. Let me know if you have any questions. Thank you.
Thank you all for your attention. I got at least five or six questions, so I’ll go ahead and answer them, and let me share my screen in case we need to look at some slides.
A couple of these are about developing a custom panel. One question was whether we offer customer antibody conjugation kits or services. Yes, we do. We sell the dyes, and conjugating antibodies to our ArgoFluor dyes is very simple because they’re small-molecule dyes; you just need pipettes and spin columns. We sell those kits for you to label in your own lab, but we also provide custom biomarker services if you want us to develop them for you. One nice thing about the conjugation services is that we’ll not only validate against the tissue type you specify, but we’ll transfer some of that reagent so you can reproduce it in your lab. We’ll also train you how to do it, and it’s very easy.
Another question was how long it takes to develop a custom panel. The main fork is whether you have to develop your own customs. If you don’t, it’s easy: order the reagents and titrate. Because all of our reagents are already validated on Orion, that cuts out a lot of the trial and error you’d have if you were looking for new reagents. If you’re doing customs, the main work is validating that clone in control tissue by IHC. We highly recommend not skipping that step, because a lot of times you’ll see nice IHC data from the vendor, but it may not have been done on your tissue or with the same antigen retrieval. Once you’ve established a clone and a control tissue by IHC, the rest is quite easy.
Another question was about the signal processing: when do we do the signal extraction? We do nice spectral spacing, but you still have spectral overlap. Once the scanner scans your slide, it generates a raw image file on the hard drive; some image corrections are done upstream of extracting the spectral overlap. That extraction is done post-acquisition, but in parallel to scanning, and you keep the raw, unextracted image if you ever need to re-derive any of the extraction. So it’s done after scanning, but kicked off in parallel: while you scan your second slide, the first slide’s processing is already happening.
There was a question about maximum plex, which we get asked a lot: will we ever go beyond this 20-channel space? If you’re going beyond 20 channels, you can cycle on the Orion. A lot of people are starting to do this, where they have discovery-level panels that might be 50-plex to inform a single-round panel somewhere around 12 to 16 markers for the translational work. In fact, one classification scheme I showed was done on a 51-plex Orion cyclic experiment. So that’s how we think people will go beyond 20 with the Orion: by doing two or three rounds to reach that higher plex. Otherwise, in this relatively crowded spectral space, we could try to add more fluors, but you’d start to impact data quality a little.
Another question was about autofluorescence. We deal with autofluorescence in two ways. First, when you prepare your sample prior to staining, we quench autofluorescence, which knocks it down by roughly 90 to 95 percent. We do still observe some on the Orion, but it’s collected into its own channel: we have a dedicated 445 laser, and we collect the autofluorescence into that channel. Because we collect it, we can use it as a basis to subtract autofluorescence from the overlap into all the other channels, giving really nice low background in the ArgoFluor channels. The system also has a secondary autofluorescence channel, because some tissues have more than one distinct signature, so you can do more complex autofluorescence subtraction.
I have several more questions that just came in. One is whether it’s possible to do intracellular staining. If you want to see cells that are secreting certain cytokines, you can certainly do intracellular staining, but in tissue it’s not so easy to stain secreted cytokines because they’re not really concentrated in the Golgi. One way that’s done in live cells is to block cytokine expression so it builds up in the Golgi and then stain, but that’s not really practical in tissue. We do have people doing same-section RNA and protein, and there are efforts to do that on the system; RNA is probably the better way to look at cytokines.
Another question was about options if you’re not ready to purchase an instrument: do we offer services? Yes, we do. We offer both instrument sales and support as well as services, so reach out if you have questions along that route.
Another question was whether we have examples of brain tissue staining or pre-conjugated antigens of interest. Brain works very well with the system; we have a couple of customers doing glioblastoma, and normal brain works quite well too. It’s true that our biomarker list is more IO-biased, mostly because the decision about what reagents to put into the catalog is dictated by what our customers are doing. We have a couple of customers where we’re transferring neuropathology or CNS-based panels, so there will be quite a few brain- and CNS-oriented biomarkers available in the catalog soon. And even if they’re not, it’s quite easy to develop your own reagents.
I’m checking with Rob to see if there are any other questions.
Moderator: It looks like at the moment that’s all the questions.
Tad George (RareCyte): Would anybody else like to submit a question before we wrap this up today?
Moderator: Tad, it does not look like there are. Thank you, everybody, for joining us today. If you have any questions, feel free to email us at info@rarecyte.com or visit our website. And if you’d like to see this webinar again, we’ll have it available on demand later today. Thank you very much, everybody, for joining us. Have a great day.
Transcript reproduced from the recorded webinar. Because the recording’s automated captions were the only available source, this transcript has been cleaned for readability: filler words and obvious transcription artifacts were removed, proper names and RareCyte product names were corrected to their standard spelling, and speaker labels were added. The speaker’s substance, claims, and figures are otherwise reproduced as spoken and may differ from formally published values.