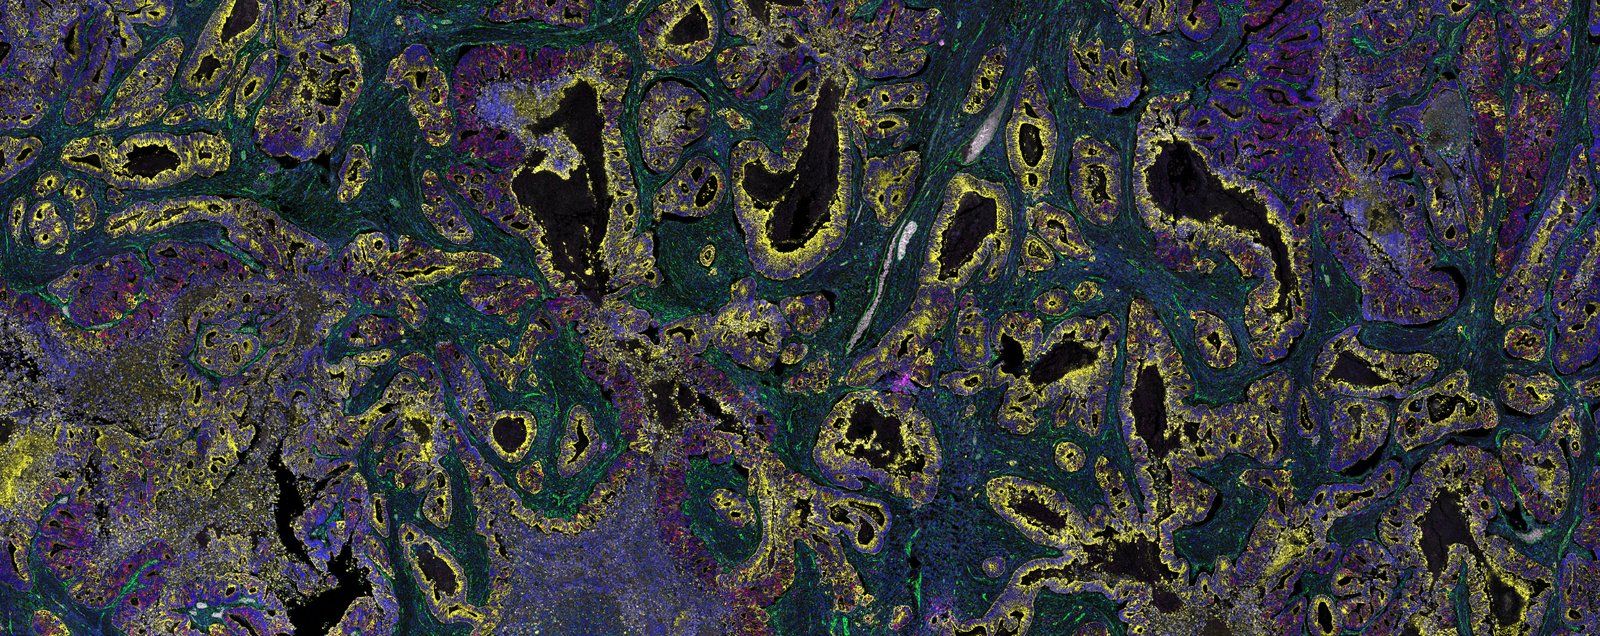
Enabling scalable, precise, and fast spatial biology studies with Orion and OMERO Plus
Analyzing multiple spatial biomarkers across entire tissue sections is a bottleneck; this AACR 2025 poster from Glencoe Software and RareCyte runs RareCyte’s Orion imaging into Glencoe’s OMERO Plus, where per-marker thresholds are called, markers are combined into cell types with boolean logic, and the populations are viewed back in spatial context — all in a web browser.
Presented by Glencoe Software.
Read or download to see:
- Orion acquisition and OMERO Plus analysis are wired into a single workflow. Orion contributes 20-channel immunofluorescence in a single staining and imaging round; OMERO Plus manages the image data and opens it in PathViewer, PathViewer GRID, Pageant, Segmentation Connector and custom pipelines, giving one path from data acquisition through analysis to visualization.
- The threshold call is the judgement call, so Pageant puts both sides of it on screen. Cell classification is time-consuming and needs expert review, so the Threshold Window displays the objects sitting on either side of a user-specified cut: at a Ki-67 mean nuclear intensity of 1057.81, that is 761 objects just below the line shown beside the 707 just above it.
- Cell types are assembled by boolean combination, then carried back into the tissue. In the poster’s worked example, PanCK+ (9,976 cells) AND Ki-67+ (3,251) resolve to a proliferating tumor population of 827; those populations load as layers in PathViewer, where the Ki-67+ cells are viewed in place within a leukocyte cluster, and a region of interest drawn on the image can define a population the other way round.