Integrative multi-omics reveals a regulatory and exhausted T-cell landscape in CLL and identifies galectin-9 as an immunotherapy target
Nature Communications. 2025;16(1):7271. DOI 10.1038/s41467-025-61822-x. PMID 40775219. PMCID PMC12331977.
How to cite
AMA
Llaó-Cid L, Wong JKL, Fernandez Botana I, Paul Y, Wierz M, Pilger LM, et al. Integrative multi-omics reveals a regulatory and exhausted T-cell landscape in CLL and identifies galectin-9 as an immunotherapy target. Nat Commun. 2025;16(1):7271. doi:10.1038/s41467-025-61822-xAPA
Llaó-Cid, L., Wong, J. K. L., Fernandez Botana, I., Paul, Y., Wierz, M., Pilger, L.-M., et al. (2025). Integrative multi-omics reveals a regulatory and exhausted T-cell landscape in CLL and identifies galectin-9 as an immunotherapy target. Nature Communications, 16(1), 7271. https://doi.org/10.1038/s41467-025-61822-xBibTeX
@article{llaocid2025integrative,
  title   = {Integrative multi-omics reveals a regulatory and exhausted T-cell landscape in CLL and identifies galectin-9 as an immunotherapy target},
  author  = {Lla{\'o}-Cid, L. and Wong, J. K. L. and Fernandez Botana, I. and Paul, Y. and Wierz, M. and Pilger, L.-M. and others},
  journal = {Nature Communications},
  volume  = {16},
  number  = {1},
  pages   = {7271},
  year    = {2025},
  doi     = {10.1038/s41467-025-61822-x},
  pmid    = {40775219}
}
Immunotherapy rarely works in chronic lymphocytic leukemia, and the reasons have been hard to pin down. Part of the answer sat out of reach: the lymph node, where leukemic B cells and T cells actually meet, is difficult to sample and had never been mapped in detail.
This team profiled T cells from CLL lymph nodes, blood and bone marrow using mass cytometry, single-cell sequencing and multiplex tissue imaging. The lymph node turned out to be its own environment, crowded with regulatory T cells and with CD8 T cells stalled in several states of exhaustion, sitting close together in the tissue.
Asking which molecular signals held that state in place pointed to galectin-9. Blocking it in mice slowed the disease, which moves galectin-9 from a correlation to a candidate target.
Key findings
- Mass cytometry across 45 samples resolved 30 T-cell clusters. A 42-antibody panel profiled 5.29 × 10⁶ T cells (median 51,937 per sample) from 22 CLL lymph nodes, 13 reactive lymph nodes, 7 blood and 3 bone-marrow samples; of the four sites, CLL lymph nodes carried the most distinct T-cell profile.
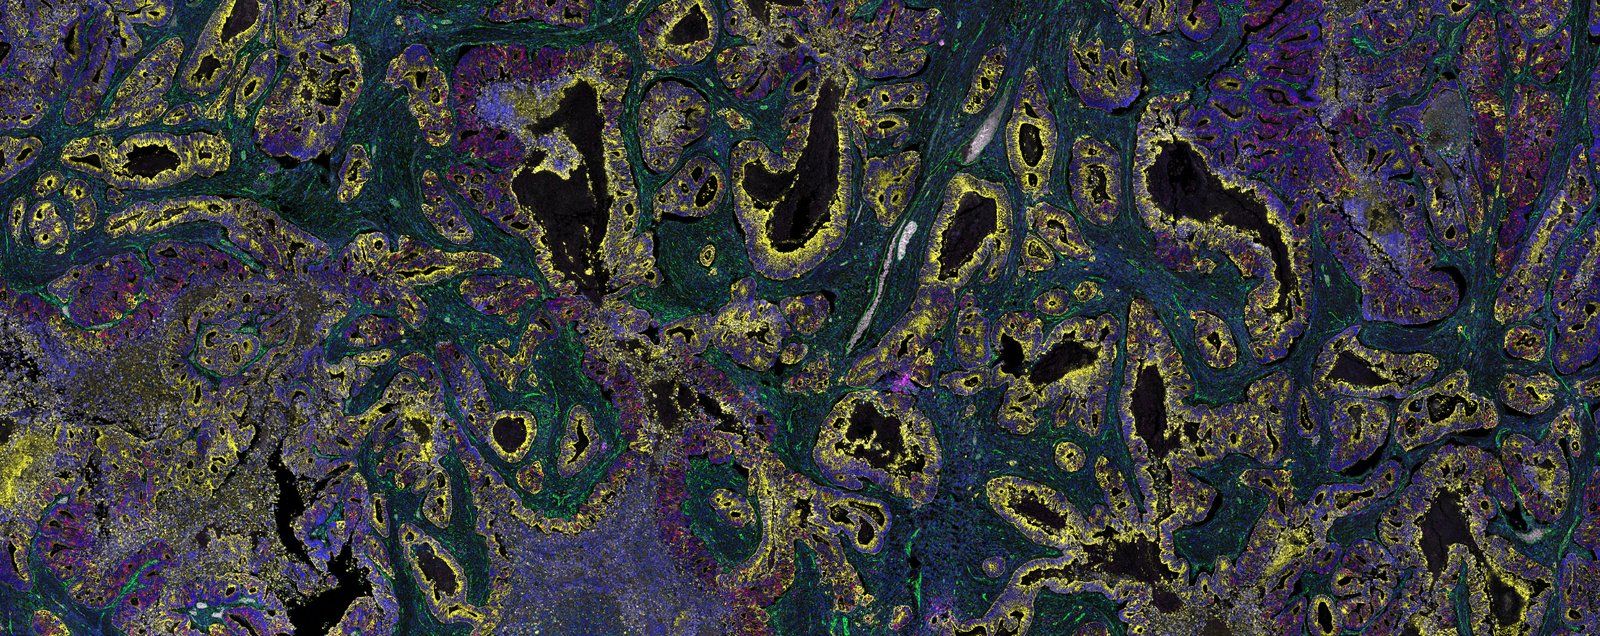
- Spatial imaging of 42 lymph-node cores from 29 patients put exhausted CD8 T cells next to regulatory CD4 T cells. Neighborhood analysis (Giotto) found enriched physical interactions between CD4 TREG and PD1+ CD8 T cells, consistent with TREG limiting CD8 activity in the CLL lymph-node niche.
- Blocking galectin-9 reduced disease progression and TIM3+ T cells in the Eμ-TCL1 mouse model. Interactome analysis nominated galectin-9 (LGALS9), a TIM3 ligand, and its expression tracked with worse survival in CLL as well as in kidney and brain tumors.
Orion in the methods
“Slides were imaged using an Orion instrument (RareCyte, Inc.) at 20X. Raw image files were processed to correct for system aberrations; then signals from individual targets were isolated to separate channels using the Spectral Matrix obtained with control samples, followed by stitching of FOVs to generate a continuous open microscopy environment (OME) pyramid TIFF image.”
— Llaó-Cid et al., Nature Communications (2025), Methods, “Immunofluorescence staining and imaging of CLL TMA”
Disclosure: RareCyte is listed as an author affiliation on the publication cited above.
Why it matters for Orion users
If you are weighing Orion for a tissue study, look at what the spatial arm was asked to carry here. The claim at the center of the paper — that regulatory CD4 T cells sit close enough to exhausted CD8 T cells to restrain them — is a claim about distance. You cannot make it from a dissociated sample, and you cannot make it from a single field of view. It needs single-cell positions across whole tissue, in enough colors to tell several T-cell states apart at once. The authors ran 42 cores from 29 patients through one staining round, then handed the images to MCMICRO, an open segmentation and quantification pipeline. Two things follow for your own workflow. One round means each slide is stained and scanned once, so the tissue is not carried through repeated stain-and-strip cycles before you have your data. And because the instrument writes OME-pyramid TIFFs, the analysis stays yours to choose — here that meant a community pipeline rather than a closed one.