Spatial Landscape of Pregnancy-Associated Triple Negative Breast Cancer and Mammary Gland Involution
bioRxiv. 2026. Preprint (not peer-reviewed). DOI 10.64898/2026.03.09.710650.
How to cite
AMA
Veraksa D, Mukund K, Frankhouser D, Yang L, Tomsic J, Pillai R, et al. Spatial Landscape of Pregnancy-Associated Triple Negative Breast Cancer and Mammary Gland Involution. bioRxiv. 2026. doi:10.64898/2026.03.09.710650APA
Veraksa, D., Mukund, K., Frankhouser, D., Yang, L., Tomsic, J., Pillai, R., et al. (2026). Spatial Landscape of Pregnancy-Associated Triple Negative Breast Cancer and Mammary Gland Involution. bioRxiv. https://doi.org/10.64898/2026.03.09.710650BibTeX
@article{veraksa2026spatial,
  title   = {Spatial Landscape of Pregnancy-Associated Triple Negative Breast Cancer and Mammary Gland Involution},
  author  = {Veraksa, D. and Mukund, K. and Frankhouser, D. and Yang, L. and Tomsic, J. and Pillai, R. and others},
  journal = {bioRxiv},
  year    = {2026},
  doi     = {10.64898/2026.03.09.710650}
}
Pregnancy-associated triple-negative breast cancer is among the most aggressive breast cancers, and it has no targeted treatment. Part of the risk traces to what happens after breastfeeding ends, when the mammary gland remodels itself back down in a process called involution.
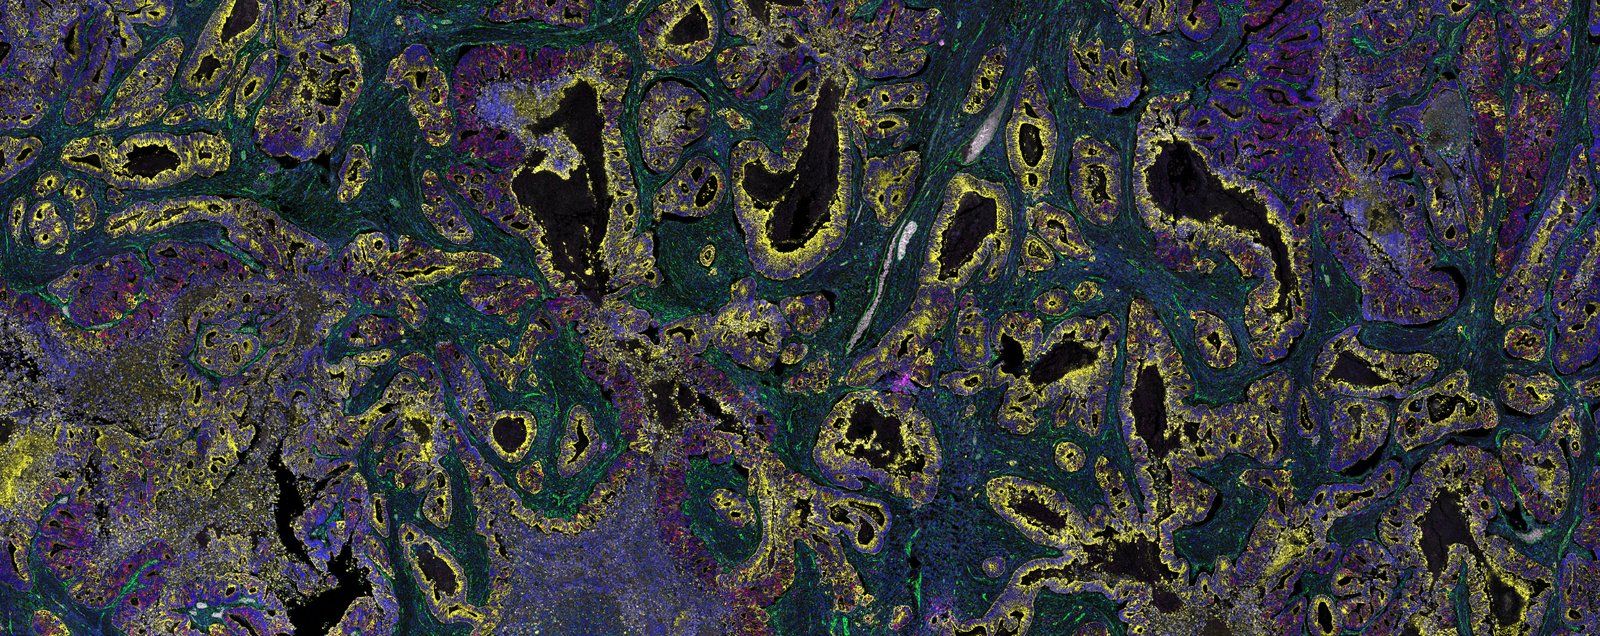
Reading the tissue in place, the authors combined spatial transcriptomics with Orion multiplexed imaging to profile treatment-naive tumor tissue from 33 women, comparing those diagnosed before involution with those diagnosed after. The largest differences were not in the tumor core but in the ordinary-looking epithelium beside it: after involution, that non-invasive tissue switched on inflammatory and developmental programs, and the surrounding microenvironment filled with immune cells caught in exhausted states.
That points to the microenvironment, not the tumor alone, as a place to intervene.
Key findings
- Spatial transcriptomics mapped 33 women with pregnancy-associated triple-negative breast cancer, and the sharpest differences between pre- and post-involution disease fell in the non-invasive tissue beside the tumor. Treatment-naive tissue from 10 pre-involution and 23 post-involution women yielded 1,815 profiled regions from 909 regions of interest across 46 slides, and only the post-involution non-invasive epithelium switched on inflammatory and developmental pathways.
- The post-involution tumor microenvironment carried the highest immune-cell content and the most exhaustion-associated cell states of the four groups compared. A pseudotime analysis placed the strongest inflammatory signaling in women diagnosed 1 to 2 years after delivery.
- Orion multiplexed imaging showed that roughly 80% of macrophages across the groups were M2-polarized, and put the highest GATA3+ CD4+ T-cell fraction in the invasive post-involution setting. In matched tissue, the sample diagnosed 1 to 2 years after delivery held significantly more CD3+ T cells and CD68+ macrophages per imaged region (CD3 p < 0.0001; CD68 p < 0.05).
Orion in the methods
“Spatial proteomic profiling was performed using Orion whole slide multiplexed imaging. Consecutive tissue sections were cut from 5 (2 PRE and 3 POST samples) of the same tissue blocks profiled by GeoMx and processed using the Orion multiplex immunofluorescence protocol (Akoya Biosciences).”
— Veraksa et al., bioRxiv (2026), Methods, “Spatial profiling using GeoMx Digital Spatial Profiler and Orion”
Why it matters for Orion users
If you are weighing Orion for a tissue study, look at the role it played here. The transcriptomic arm told the authors which regions differed; Orion was what let them go back to the same tissue blocks and count individual cells in place. On consecutive sections from five samples, a single staining round with a ten-marker panel resolved T-cell states, CD4 subsets, and macrophage polarization at single-cell resolution across whole slides. That was enough to show that roughly 80% of macrophages were M2-polarized and that the invasive post-involution setting held the most GATA3+ CD4+ T cells. Two things carry over to your own workflow. Because each slide is stained and imaged in one round, the tissue is not pushed through repeated stain-and-strip cycles before you have your data. And because Orion writes whole-slide images you analyze in an open tool, here QuPath, the segmentation, thresholding, and quantification stay under your control rather than inside a closed pipeline.