Qualitative and quantitative evaluation of the tissue micro-environment by high-resolution 17-plex immunofluorescence reveals distinct cell populations
Multiplexed tissue images are only useful if you can both see the cell populations and measure them; this SITC 2021 poster pairs a single-scan 17-plex Orion immunofluorescence panel with HALO AI image analysis to qualitatively visualize and quantitatively profile the distinct cell populations of lymphoid tissue.
Presented by RareCyte and Indica Labs.
Read or download to see:
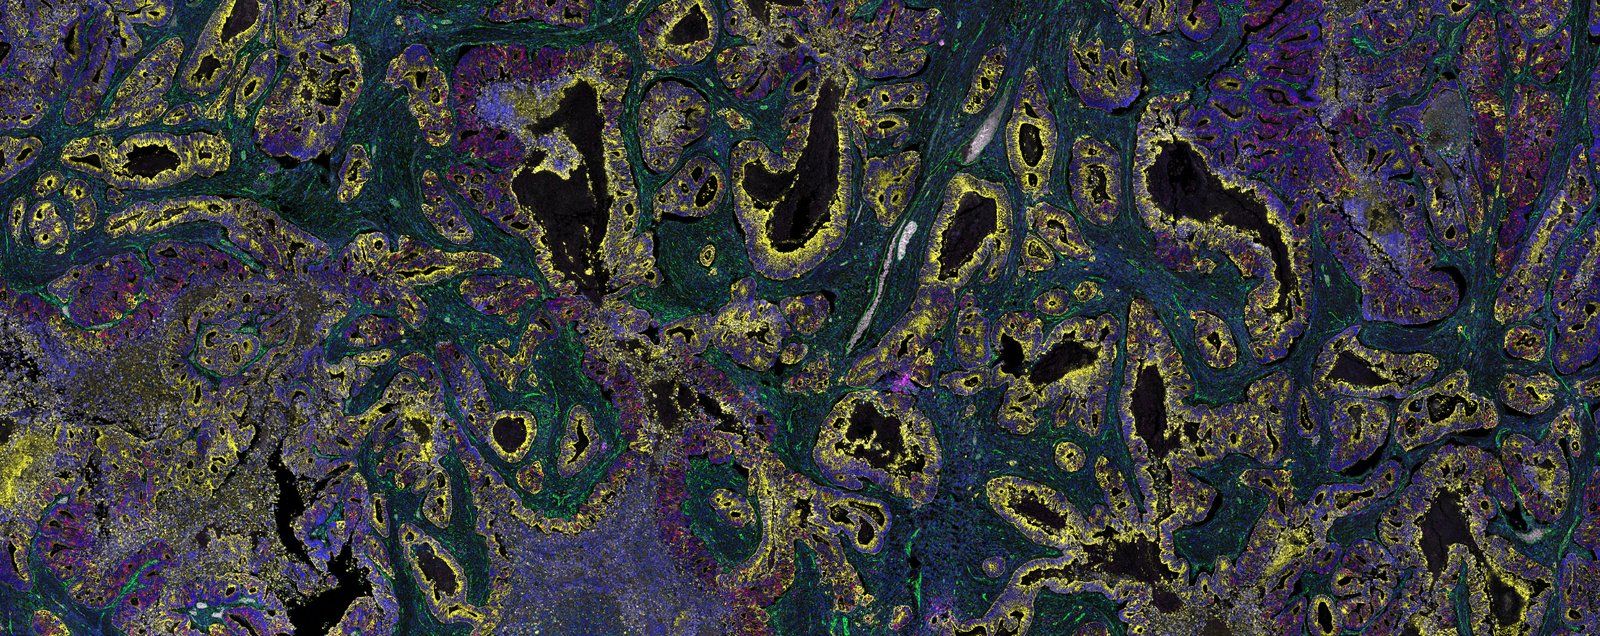
- A single Orion scan captured a 17-plex immunofluorescence panel across whole slides of three lymphoid tissues. FFPE sections of reactive tonsil, quiescent lymph node and SLL/CLL lymphoma were stained with one 17-plex panel — spanning leukocyte, B-cell, T-cell, macrophage, checkpoint, vascular, epithelial and proliferation markers plus a nuclear dye — and imaged whole-slide in a single scan on the Orion instrument, then fed to a downstream HALO AI image-analysis workflow.
- Qualitatively, the images placed distinct cell populations in their spatial context across all three tissues. Follicular B cells (CD20), interfollicular T-cell zones (CD3d, CD4, CD8), macrophages (CD68, CD163), blood vessels (CD31) and proliferating cells (PCNA, Ki-67) were read directly from the panels, showing for instance that nearly all germinal-center B cells in the reactive tonsil were proliferating while the lymphoma cells expressed PCNA but not Ki-67.
- Quantitatively, HALO AI segmented the tissue regions and measured how they differed between the reactive tonsil and quiescent lymph node. The T-cell-to-B-cell zone-area ratio was 27% lower in the tonsil than the lymph node (2.6 versus 3.6); the T-cell region ran 81.9% CD3+ in the lymph node against 50.7% in the tonsil; and the CD4:CD8 ratio fell from 3.1 to 1.4, marking the tonsil’s more balanced helper-to-cytotoxic T-cell mix.