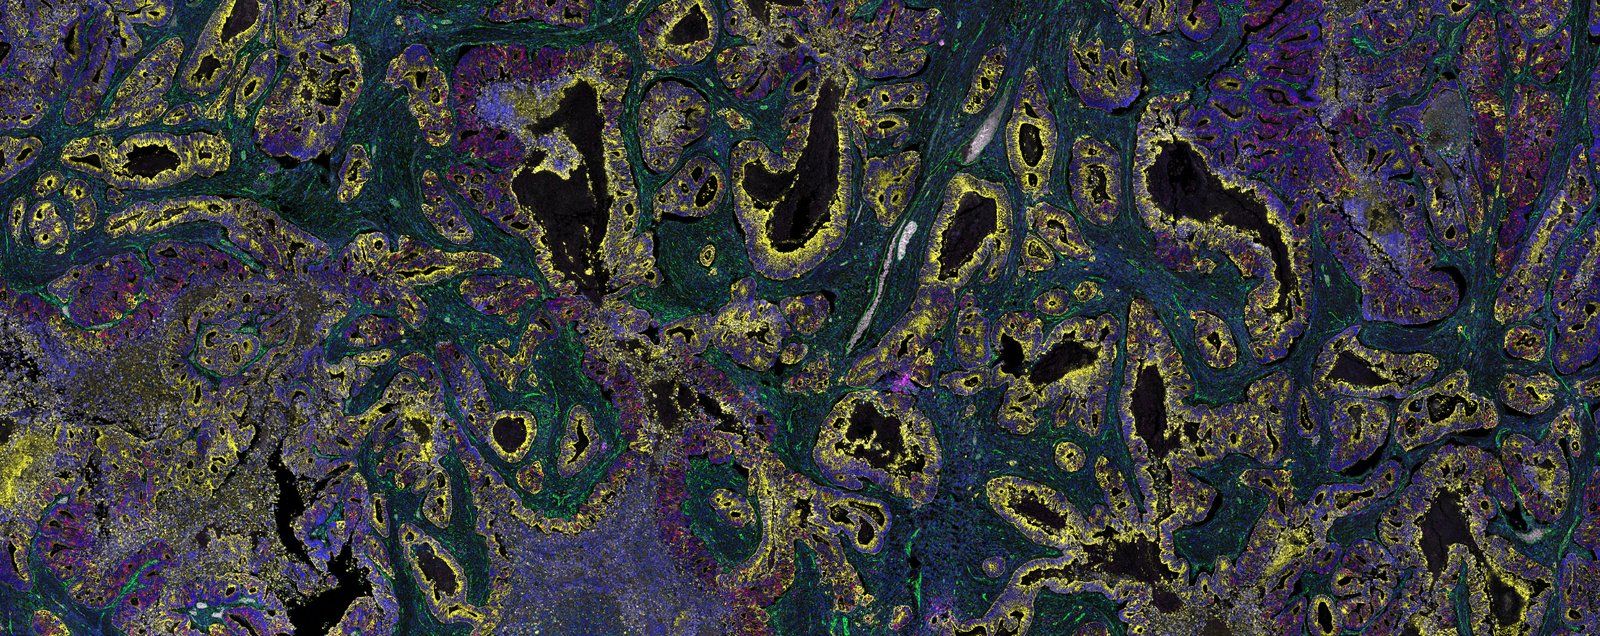
Quantitative analysis of colorectal adenocarcinoma images obtained by one step 15-plex staining followed by imaging with the Orion™ spatial biology platform
Mapping a tumor microenvironment takes plex, resolution and whole-slide context together; this AACR 2024 poster quantifies one invasive colorectal adenocarcinoma section at single-cell resolution using single-step 15-plex staining followed by Orion imaging, then H&E on that same section.
Presented by RareCyte.
Read or download to see:
- A 15-plex immune-oncology biomarker panel, stained in one step and imaged across the whole slide. The section was stained in a single step, imaged whole-slide at 20X on the Orion instrument, then de-coverslipped and H&E-stained on that same section, so one slide carries both the multiplex image data and a conventional H&E view. The panel’s markers are Hoechst, CD31, Ki-67, CD163, CD20, CD4, CD8a, CD68, PD-L1, FOXP3, E-cadherin, PD-1, CD45, Pan-CK and SMA.
- E-cadherin fell and Pan-CK rose from normal colon out to the invasive margin. Fig 4 quantifies E-cad and Pan-CK MFI across five regions of the section — normal colon, superficial tumor, central tumor, near invasive border and invasive margin — and Fig 6 shows the same progression in the images. Proliferation did not follow that gradient: among E-cad-positive cells it peaked at 31.6% in the superficial tumor against 6.9% in normal colon, and it stayed above the Pan-CK-positive cells in all five regions, 31.6% versus 23.6% at the peak.
- Immune and endothelial populations were larger in the tumor region than in the healthy muscle. Fig 5 sizes six of them — CD4, CD8a, CD20, CD68, CD163 and CD31 — as a percentage of total cells, and each one is higher in the tumor than in the muscle. Fig 3 shows the same contrast in the images: lymphocytes, macrophages and endothelial cells sit in and around where the tumor has infiltrated the submucosa and muscle layers, while minimal immune and endothelial presence is seen in the normal smooth muscle.