RareCyte Technology Presentation at Harvard Medical School
Two RareCyte presenters walk a Harvard Medical School audience through one imaging platform for rare cells and tissue, from circulating-tumor-cell liquid biopsy to micro-region retrieval that feeds molecular analysis.
At a RareCyte technology talk hosted by Peter Sorger’s group at Harvard Medical School, two RareCyte presenters make the case for a single high-performance imaging platform that carries a sample from discovery research toward clinical diagnostics, across both liquid biopsy and tissue. Layton, RareCyte’s Vice President of Business Development, walks the rare-cell (circulating tumor cell) workflow of AccuCyte® sample preparation, RarePlex® multiplex staining, and CyteFinder® imaging with CytePicker single-cell retrieval, and uses an independent University of Washington breast-cancer study to argue that protein enumeration and molecular sequencing answer different, complementary questions. Kyla, a RareCyte Senior Product Manager trained as an engineer, then shows the tissue side: whole-slide multiplex immunofluorescence with micro-region and single-cell retrieval feeding RNA-seq, demonstrated on tonsil tissue with a Harvard lab under an STTR grant.
In this video:
- The one-platform thesis: RareCyte argues one high-performance imaging system can carry a sample from discovery toward clinical diagnostics, across liquid biopsy and tissue.
- CTC workflow: AccuCyte collects every nucleated cell, no size/marker selection; RarePlex stains up to 7 parameters, imaged on CyteFinder to ID and phenotype the cancer cell.
- Why slides can be banked: blood stays stable ~3 days before processing, then at least a year on a slide, so specimens archive as assays develop; ML scores each cell for review.
- Protein and molecular readouts complement: a University of Washington study exome-sequenced CTCs from a triple-negative breast cancer case, most mutations at lowest CTC counts.
- Tissue: CyteFinder II's CytePicker picks micro-regions or single cells from whole slides; a lung-cancer CD3/CD45RO/PD-1/cytokeratin panel reads T-cell exhaustion, infiltration.
- Pick-then-sequence PoC at Harvard: CytePicker took 5-10 cells per 40-µm pick of FFPE tonsil for RNA-seq, flagging a stain-confirmed CD21 difference between two B-cell follicles.
Full transcript
Host (introduction): I’ll first introduce Layton and Kyla; both will speak. Kyla is trained as an engineer and is now a Senior Product Manager at RareCyte, focusing on cellular imaging products and specializing in high-resolution fluorescence imaging. Layton is the Vice President of Business Development at RareCyte, and he has extensive experience in multiplex tissue imaging technologies. So, excited to hear what they have to say. Everybody, smile.
Layton (RareCyte): Well, thank you, Peter, that’s good to know. It really is our pleasure to be here. Thank you, Sandra; we certainly appreciate you pulling this event together, we know how much work it can be, and also the team behind the scenes, Madison and Chris and others. We appreciate all your effort. We’ve been working with Ultivue for a little while, so hopefully what we’re going to bring together today is a story across imaging, analysis, and a deep review, with really enabling reagents. We’re going to try to bring that story together for you this morning, and we’ll pass from one to the other as we go.
So at RareCyte we really have a sharp focus on oncology, and when you look at the statistics it’s fairly clear why. In the US last year, in 2018, there were 1.7 million new cancer cases and nearly 700,000 related deaths; when you take that to a worldwide scale, it’s roughly tenfold that. So this really is a global epidemic that is very significant. And while there have been incredible advances in immuno-oncology and precision medicine, there’s still much more to be done, because the actual rates of mortality are not declining for many of the major indications where early screening is not involved. So in my part of the presentation I’m going to talk about two things: a little about liquid biopsy, which I’ll try to connect to tissue for you, and then our tissue platform, where I’ll start to show you some of the early applications work we’ve been doing with the immuno-oncology reagents.
RareCyte has a vision to enable the next generation of analysis for rare cells and tissues, for both research and diagnostics, and therefore for patient outcomes; that’s our liquid biopsy piece. This company has very deep experience and expertise in high-performance imaging, imaging at the leading edge in high resolution and super-resolution, and also a clear past in a previous company around high-content screening systems. It’s that expertise and capability that cuts through into our current platform, not only in the instrumentation but also in the engineering behind the scenes in terms of sample preparation and so on. So what we’re going to focus on is some rare-cell analysis first, where we have an end-to-end platform to identify cells in patient blood, to phenotype them with a number of markers, and then also to retrieve those cells. That retrieval cuts across both single cells in a liquid biopsy and tissue micro-regions in a tissue sample. Our platform is used worldwide in academic centers; we’re very pleased that Peter is a close collaborator, along with others here, in pushing the boundaries of our systems. We have ongoing clinical trials and diagnostic relationships with many big pharma accounts. We’re based in downtown Seattle, where we have a facility that supports our application development, product development, and manufacturing, and the key message is that we’re building up that infrastructure to enable the quality and regulatory capability to support companion diagnostics for pharmaceutical companies. So what you may have interpreted is that we’re talking about one platform to go from discovery to diagnostics, with the belief that the same platform, the same high-performance imaging, the same types of user interfaces, and in some cases the same reagents cutting through, is going to be a significant advantage, particularly for anyone in that translational space.
On tissue imaging, it’s high-performance multiplex immunofluorescence, as well as brightfield for H&E and IHC, automated high-resolution whole-slide scanning, which is very fast (I’ll give you some stats a little later), and then the micro-region retrieval that’s really important for deeper investigation. On the cell imaging side it’s the same story, still multiplexed immunofluorescence, but added onto that is the capability to take patient blood, extract nucleated cells or cancer cells (CTCs), spread them onto a slide, and then use them for downstream phenotyping and molecular analysis. At the bottom of this page you see the product line, which I’ll tell you about in a little bit, cutting across basic research through the translational phase into potential clinical diagnostics.
So this is the overview of the product platform portfolio; this one is focused a bit on the cell-based work, and I’ll try to connect it to tissue in a few moments. We have a sample preparation system called AccuCyte, which is basically a simple centrifugation-based system that collects all nucleated cells in patient blood. It doesn’t select on the basis of any biomarker, size, or shape, so it really collects everything that’s there, and its recovery and sensitivity are incredibly high. Once collected, we spread the cells onto a standard microscopy slide and then do staining and imaging. The staining is done by the RarePlex staining kits, which have up to seven parameters available; that’s also true for the tissue work we’re doing. So there are seven channels available on the instrumentation. In the case of liquid biopsy we use three for the cancer cell and then have up to four open channels to phenotype those cells. There are two models of instrument, and they split really by their usage. They’re very similar in capability, but we have one that’s a high-throughput device that would typically be found in a core-lab scenario and can handle up to 80 slides in an automated fashion; everything is barcode-driven, so it’s LIMS-compatible, and in terms of sample tracking and management it’s directly integrable into LIMS systems. The second system is the CyteFinder II with CytePicker, our needle-based picking device for micro-region retrieval of tissue or single-cell retrieval of liquid biopsy samples. That becomes so critically important because we have a strong belief that protein analysis and molecular analysis are complementary; it’s not one or the other, you gain different information, and as I’ll show you in a dataset a little later, that information is critically important both in drug development and in patient diagnosis.
Thinking about the liquid biopsy workflow first, how do those products fit? In traditional pathology it’s collect the sample, make the block, cut the sample, put the section on a slide, stain the slide, and pathology review. This is very analogous, both in our liquid biopsy mode and in our tissue mode. In this case there’s a blood draw from a patient that would happen locally at a hospital or a remote site, then three days of stability where that sample can be either used or shipped somewhere; particularly in a CRO scenario where diagnostics are being performed, that shipment could be global. Then it’s processed onto a slide, and once on a slide it’s stable for at least a year, which means those slides could be banked and stored while biomarkers were being discovered, while assays were being developed, and while clinical trial processes were being configured. Then we stain, scan, and image, and the output, in this case for cell-based work, is a report. That report uses machine learning across a large number of inputs to score a cell as a definite cancer cell, maybe a cancer cell, or probably not a cancer cell, and that score is then used by a pathologist or trained reviewer to quickly check through and confirm the scores. After that scoring process there is the opportunity for single-cell retrieval and analysis, and Kyla will talk a lot more about that later and show you some data.
This is the only dataset I’m going to show, but it’s a really important one. It’s work that was performed by the University of Washington; it was an independent study, and I’m going to use it to make my point about the combination of protein and molecular being so valuable and impactful in patient diagnosis, and equally in research. On the top graph you’re seeing enumeration of cancer cells in patient blood; this is a late-stage triple-negative breast cancer patient. As you can see in the top chart, there’s a very high number of cancer cells when that patient initially presented, over a thousand cells per milliliter of blood. That patient then went through platinum-based treatment; there was a spike in the cancer cells in blood, presumably as cells were shed from the tumor, and it then declined to a baseline. This was monitoring over 50 weeks, and you can see a large number of samples; obviously this couldn’t be done by traditional tissue biopsy, so the impact of liquid biopsy here is clear. That patient then began to progress, went through secondary treatment, and you see the same sort of spike and then a decline back to a baseline. What’s shown in the bottom chart, aligned with the arrows in the top one, is that individual cells were picked from that patient’s sample and went through whole-exome sequencing. What you see is susceptibility genes and oncogenes laid out side by side, and if you look globally at the data, the number of mutations is greatest when the number of CTCs in the patient’s blood is lowest, suggesting a greater number of variants occurring when the CTC count is lowest. The implication is that these are probably the most dangerous cancer cells in that patient, constantly mutating and beginning the progression we see over time. So you combine the protein-based information, which says this patient looks in great shape for thirty weeks, with the molecular data, which says hold on, there’s something else going on.
That was a dataset on cell-based work; now we’re going to switch to tissue analysis. I described the workflow for tissue, and it’s very similar. In this case we’re showing the use of Ultivue’s UltiMapper kits. We like those kits; this could be any type of kit, but we’re going to show you some great data with those. Staining is done on automated systems or via manual imaging on the CyteFinders, and either way, image visualization is on our CyteHub software, which I’ll talk about in a moment as a really powerful tool for interrogating data. Image analysis is with Indica Labs’ HALO product, and then finally there’s the option to retrieve individual micro-regions from tissue. This slide shows some of the features of the instrumentation, the two products I mentioned, the CyteFinder II and the CyteFinder HT, separated at the moment by one having the CytePicker and one not; in our roadmap we suspect high-volume picking is going to become a standard both in academia and industry. Some features in the middle, as I mentioned, are high resolution; these are amazing-quality images, and it’s a very fast scenario, typically around ten minutes for a 1.5 by 1.5 millimeter section, so it’s very high-throughput. The last thing to mention here, importantly for this integrated discussion, is that these files are all available in terms of their file structure for use by other downstream software; there are no proprietary file structures in place.
I mentioned the CyteHub software. For anyone working in a high-volume lab, the impact of this shouldn’t be underestimated; you generate large amounts of data, large image files, gigabytes that go to terabytes very quickly across the overall number of datasets you have, so the need for a really powerful, stable, and robust database to support those images is very strong. We have CyteHub software that works with both cells, for the liquid biopsy, and tissue images. This is a scenario where you can set up projects, have multiple users, and everything is password-controlled; you set up your project and then manage all of that information and data in that database. In this first example we show a nice image in full screen that enables a user to move around and interrogate it deeply. Once you have that image, you can pan and zoom around it in digital pathology mode, looking for regions of interest and zooming in to find particular cells of interest. You can annotate those images with anything you want, and more importantly some information about the cell type, and then you can use pseudo-colors in any format you prefer; once you have your color panel defined, you can use it across all your images and share it with others. One of the most important features is that this is a server-based system where all of that information can be accessed remotely, so a scenario where a scientist generating data is working with a pathologist to review it in different locations is readily achievable. For the multiplexed imaging piece, this software supports side-by-side comparison of up to six images, so comparing colors and looking at different phenotypes is readily achievable. With that, I’m going to pass to Kyla, who’s going to talk a little more about some imaging and show you some examples of the tissue datasets.
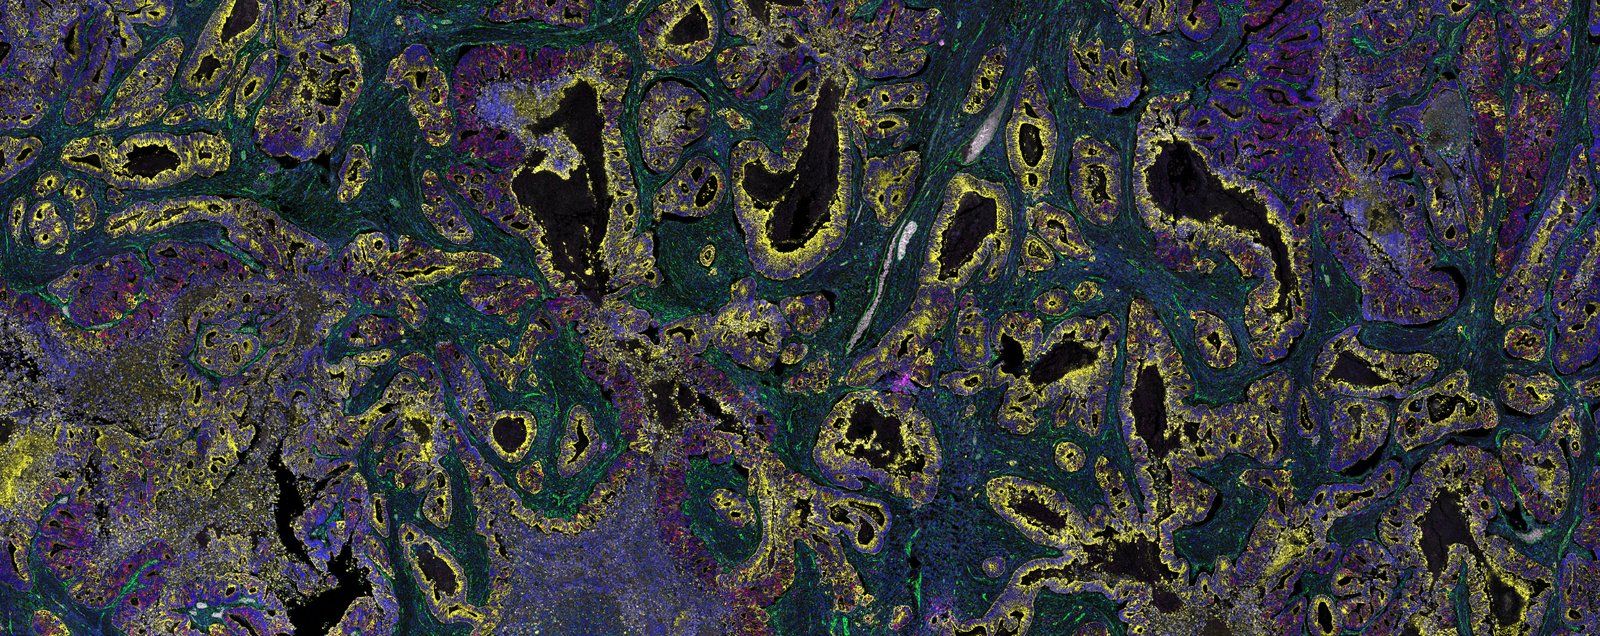
Kyla (RareCyte): Thank you, Layton. I’m excited to take you through the tissue imaging workflow with some examples showing Ultivue’s UltiMapper I/O kits, and then some of the tissue-picking work we’ve done in collaboration with Peter Sorger’s lab here, through an STTR grant. As Layton alluded to, tissue has information at multiple levels: from the architectural level down to the cellular detail level, and finally at the molecular level, from RNA and DNA expression. The CyteFinder platform allows you to interrogate all three levels of information from the samples. So this is some CD3 T cells in lung cancer tissue, stained with the UltiMapper PD-1 kit; some nice T cells. With multiplex immunofluorescence you can start to layer in other markers to learn more about these T cells. Here you’ll notice that some of the T cells are co-expressing the memory marker CD45RO, and now we layer in the exhaustion marker PD-1, and you’ll start to notice that quite a few of these cells are showing T-cell exhaustion. And then if we finally layer in cytokeratin and the nuclear stain, you start to see more of the structure of the lung cancer tissue, and you’ll notice that these T cells are infiltrating between the alveolar regions of the lung cancer. You start to ask more questions: what’s happening here, can I learn more about those individual T cells, and are the ones invading into the cancer regions the same as or different from the ones in other parts of the tissue?
So with that I’ll move on to what we call our PicSeq workflow. The CyteFinder II imaging system has the integrated CytePicker retrieval module, which is just a little needle, sort of like a biopsy needle, that gets loaded into the instrument. We have a little cassette with a rack of needles in it; you load it in, the instrument picks up a needle and automatically does the calibration, and then you take the rack out, put in your sample, and you’re ready to go. At this point you will have already done whole-slide imaging of your sample and, in the software, reviewed those images and marked regions of interest that you want to go back to for retrieval. Those coordinates get loaded back into the system, you load the sample in, and using the needle you just say pick cell, and it will move the needle down and aspirate the cell off of the slide and transfer it to a PCR tube. You can use any PCR tube, but RareCyte has developed a flat-bottomed version that allows us to image through the bottom, so we can confirm the deposit of your cell into the tube. This is a nice confirmation, because if you’re going to take that into downstream molecular analysis, which can be quite expensive, it’s nice to know that your sample made it in there. With transcriptomic analysis of samples, you can interrogate thousands of levels of expression in those cells.
So this is a proof-of-concept experiment we did using the tissue-picking workflow. In this case we started with FFPE tonsil tissue and stained it with a panel on one serial section, which allowed us to find regions of interest for picking. On the second serial section we did just a brief nuclear stain and then retrieved regions of interest, and then we did an RNA-seq analysis on those retrieved sections, which allowed us to discover something about the sample and confirm the RNA-seq findings on a third section. The reason we don’t do the retrieval directly from the stained sample is that antigen retrieval seems to be incompatible with RNA quality, so you can’t do RNA-seq on samples that have undergone antigen retrieval. Here is a quick whole-slide image of tonsil tissue stained with a really basic panel; we’ve got CD3 marking T-cell zones and CD20 marking B-cell follicles, and we’ve identified several regions where we’d like to do picking. Here you can see we’ve used the coordinates from the first slide to go back to the same region on the serial section that was only stained with a nuclear marker, and we can retrieve samples from each of those regions. This was using a 40-micron needle, so each punch is 40 microns across; at 5 to 10 cells per pick, it’s not a single-cell pick in this case, we’re getting just a few. We ran RNA-seq on those individually picked regions, and after doing differential expression analysis and hierarchical clustering we get nice differential expression of the expected T-cell and B-cell markers. You can see that the T-cell zones are differentially expressed from the B-cell zones, which is what we expected. We also ran this data through CIBERSORT, which looks at a trained dataset for cellular phenotypes in the RNA-seq data and tries to deconvolve which cell types were in the picks, and we get what we expect: in the T-cell zones, mostly T cells, and in the follicles, primarily B cells, but you can see there were probably also some other cell types in those picks.
Because an RNA-seq dataset is very large, we wanted to convince ourselves that we weren’t just seeing what we wanted to see, so we ran a principal component analysis (PCA), which takes all of the thousands of data points you get from RNA-seq and collapses them into a nice 2D plot; dots that cluster together have similar transcriptomic expression levels. You’ll see here that the T-cell zones cluster nicely together and are differentially expressed from the follicles. The one thing we weren’t expecting was that the follicles actually cluster separately from each other, which says that in transcriptomic space they’re actually very different. That led us to do further investigation, and we came up with several genes; first we just confirmed that the T-cell and B-cell zones differentially express this T-cell marker, which we expect, and then here are some additional B-cell markers where the two different follicles have slightly different expression levels. I’ll draw your attention to the CD21 marker, where follicle A has much stronger expression than follicle B. That led to what we call a PicSeq-informed panel, where we took the next serial section and stained it with this new panel, and you can see that the staining replicates the RNA-seq expression data. So this is pretty exciting; we think this could be used as a biomarker discovery tool. Now, CD21 is not a very exciting biomarker to discover in tonsil tissue, but you could imagine doing this on a much more exploratory level. I should also point out that we came up with the markers, and the Harvard team had already had some experience using them, so they very rapidly threw together a list of off-the-shelf antibodies we could use to try to stain it, and we had transferred the assay and done the staining in less than two weeks; that’s actually very rapid panel development, in part because of a lot of the work that the LSP has done developing a nice cohort of qualified biomarkers.
So just in summary, the CyteFinder II uniquely enables discovery at all three levels of information that you can achieve in tonsil tissue, or in FFPE tissue, and really any type of tissue. With that, I’d like to give a quick acknowledgement to the LSP for their collaboration work; they helped us with a lot of the sequencing analysis for the PicSeq experiment I demonstrated, which was done under an STTR grant that we’re currently doing with Peter Sorger’s lab.
Transcript reproduced from the recorded presentation and lightly edited from an automated (yt-dlp) caption source for speaker labels, punctuation, obvious transcription artifacts, and the accuracy of proper names; the presenters’ words are otherwise as delivered. RareCyte product names were normalized to their correct forms (AccuCyte, RarePlex, CyteFinder, CytePicker, CyteHub). The presenters’ surnames and the third-party reagent-partner brand were too garbled in the automated captions to confirm independently and are given by their best-identifiable reading, flagged for source confirmation. Statements of affiliation, quantities, and study details are reproduced as spoken by the presenters and may differ from formally published values.