A spatial human thymus cell atlas mapped to a continuous tissue axis
Nature. 2024;635(8039):708-718. DOI 10.1038/s41586-024-07944-6. PMID 39567784. PMCID PMC11578893.
How to cite
AMA
Yayon N, Kedlian VR, Boehme L, Suo C, Wachter BT, Beuschel RT, et al. A spatial human thymus cell atlas mapped to a continuous tissue axis. Nature. 2024;635(8039):708-718. doi:10.1038/s41586-024-07944-6APA
Yayon, N., Kedlian, V. R., Boehme, L., Suo, C., Wachter, B. T., Beuschel, R. T., et al. (2024). A spatial human thymus cell atlas mapped to a continuous tissue axis. Nature, 635(8039), 708-718. https://doi.org/10.1038/s41586-024-07944-6BibTeX
@article{yayon2024spatial,
  title   = {A spatial human thymus cell atlas mapped to a continuous tissue axis},
  author  = {Yayon, N. and Kedlian, V. R. and Boehme, L. and Suo, C. and Wachter, B. T. and Beuschel, R. T. and others},
  journal = {Nature},
  volume  = {635},
  number  = {8039},
  pages   = {708--718},
  year    = {2024},
  doi     = {10.1038/s41586-024-07944-6},
  pmid    = {39567784}
}
The thymus is where T cells learn to tell self from non-self, and that education depends on where each cell sits as the organ develops. Reading a tissue this intricate means knowing both what each cell is and exactly where it lies, from fetal life through early childhood, and single-cell and spatial datasets are hard to stitch together across an organ that keeps changing shape.
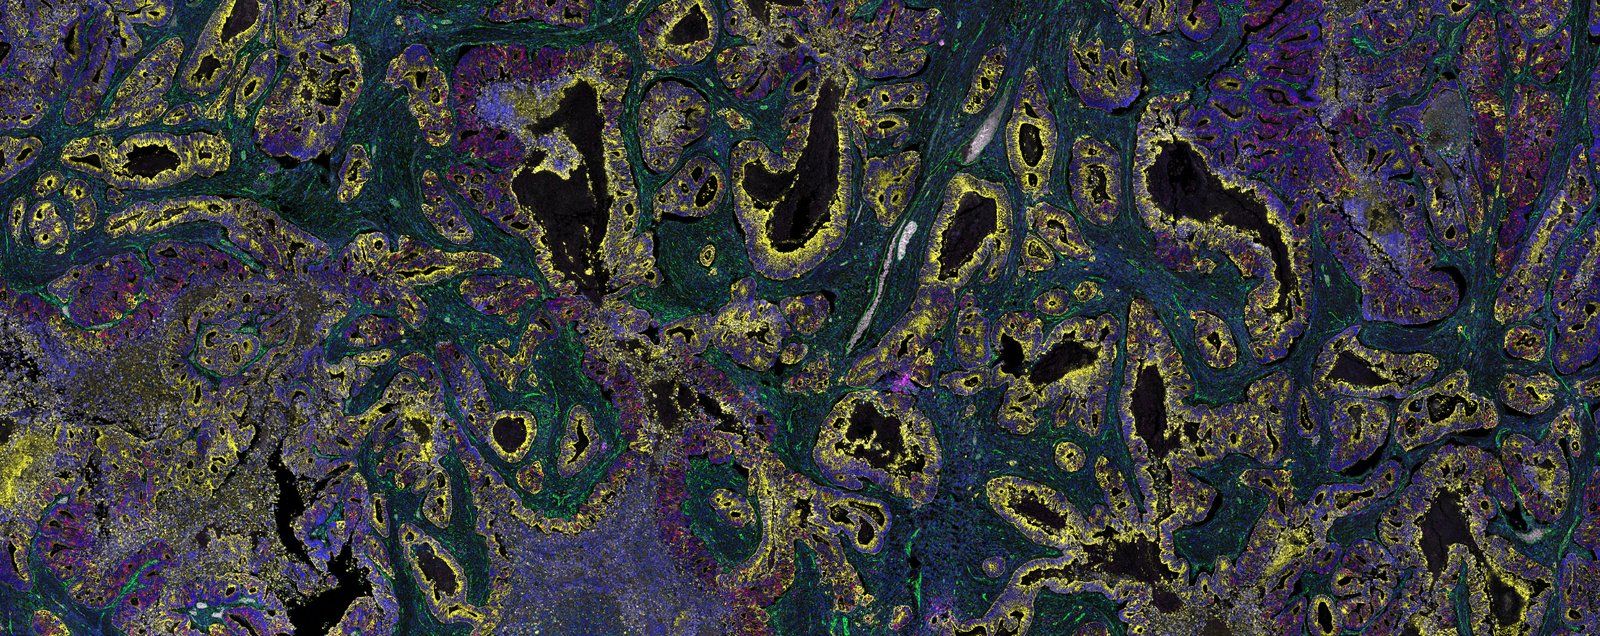
The team built a multimodal atlas of the developing human thymus, combining single-cell sequencing with several spatial methods and placing every measurement on one continuous cortico-medullary axis. Single-round 14-plex RareCyte protein imaging supplied the protein-level view, pinpointing where specific epithelial progenitor cells sat in intact tissue as an orthogonal check on the sequencing.
Key findings
- The atlas integrated single-cell and spatial data across development. It combined 266,551 cells from published datasets with 146,352 CITE-seq and 69,748 stromal single-cell profiles across 29 donors, spanning fetal life to three years of age.
- Every measurement was placed on one continuous cortico-medullary axis. Spatial transcriptomics, 44-plex cyclic imaging that yielded 1,101,631 nuclei from eight samples, and 14-plex single-round RareCyte protein imaging were all registered to the same coordinate framework.
- RareCyte protein imaging pointed to a putative epithelial progenitor niche. The 14-plex stain detected CD45-PanCK+Ki-67+ proliferating epithelial cells in subcapsular zones of the early fetal thymus at 12 post-conception weeks.
RareCyte in the methods
“The slides were imaged the next day using the RareCyte Orion microscope with a ×20 objective and relevant acquisition settings were applied using the software Artemis v.4.”
— Yayon et al., Nature (2024), Methods, “RareCyte immunostaining and 14-plex imaging”
Why it matters for RareCyte users
If you are weighing RareCyte for a tissue study, look at the job its protein imaging was given here. This atlas leaned on single-cell sequencing for cell identity, but sequencing discards position, and the authors still needed to see specific cells in place. RareCyte supplied that view: a single-round 14-plex stain read across whole FFPE and frozen sections, resolving cells by marker combination without dissociating the tissue. Because the acquisition is single round rather than cyclic, the panel is read in one pass, which keeps handling of these small, irreplaceable developmental samples simple and protects antigen signal. That was enough to place CD45-negative, pan-cytokeratin-positive, Ki-67-positive epithelial cells in the fetal subcapsular zone and mark a candidate progenitor niche the sequencing had only proposed. For your own work the lesson is narrow and useful: RareCyte can serve as the protein-level, in-tissue check alongside sequencing and other spatial assays, showing where a population sits rather than only what it expresses.